MATIC Price Prediction: Polygon Coin Price may Lose $1 Mark if this Bearish Pattern Set-off


MATIC Price Prediction: With the increasing FUD in the crypto market, the MATIC price downtrend has recently taken a slight detour and turned sideways. The price action moving with lower highs and higher lows within two converging trendlines has revealed an inverted pennant pattern formation. In theory, this technical setup indicates the prices are likely to continue their downward trend once it breaks below the lower trendline. Here’s how you can use this pattern to your advantage.
Key Points
- The area between the two trendlines of the pennant pattern can be considered as a no-trading zone
- A potential breakout from either of the trendline will determine the future price movement.
- The intraday trading volume in the MATIC is $167.9 Million, indicating a 21% gain.
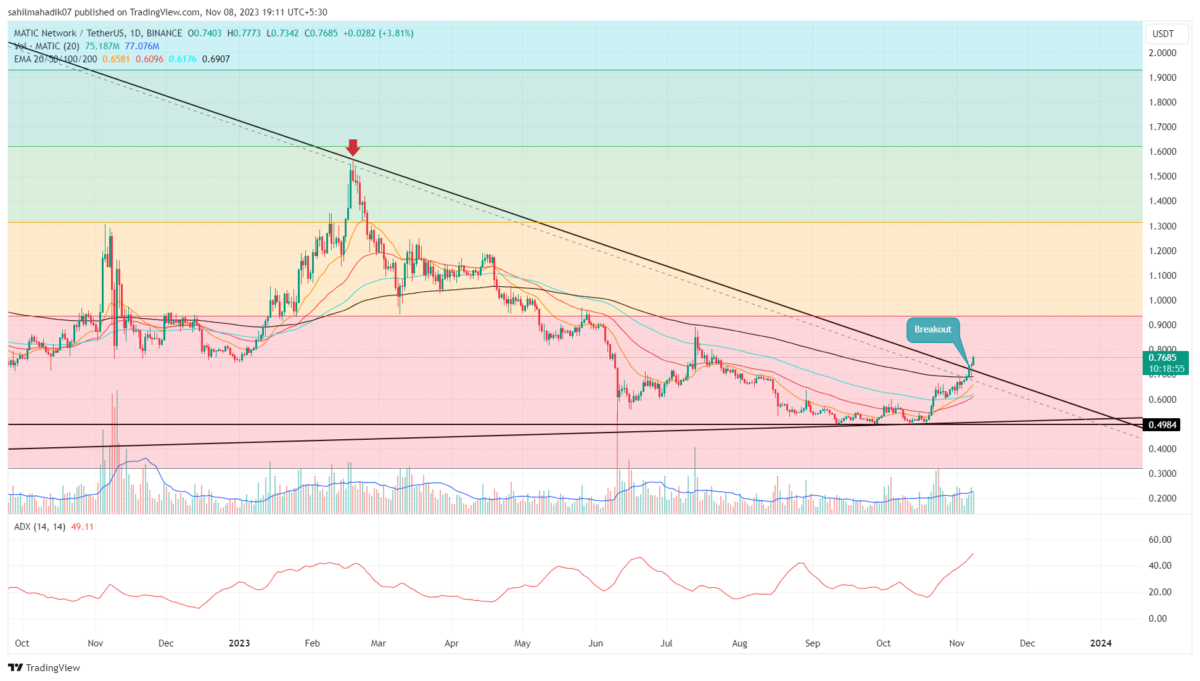
 Source-Tradingview
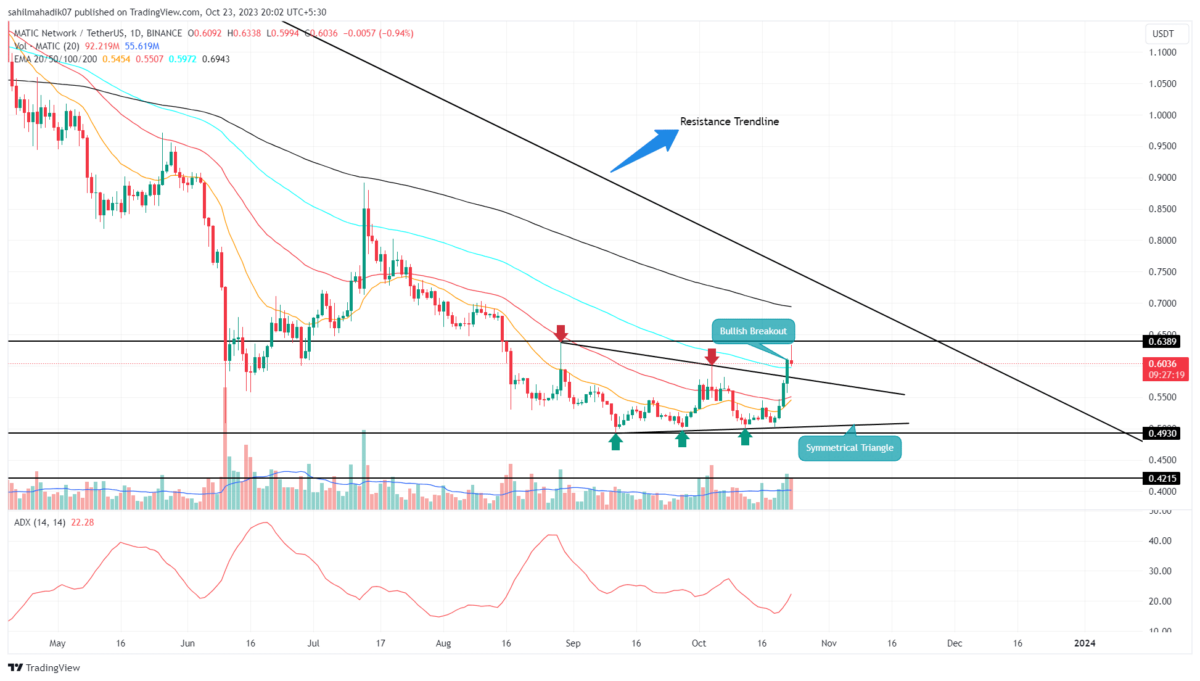
Over the past six days, the MATIC price has been resonating within the two converging trendlines of the bearish pennant pattern. The prices have bounced back at least thrice from both the trendline indicating the traders are responding to this technical setup and would likely respect its potential target.
By the press time, the polygon coin price trades at $1.1 and is trying to sustain above the lower trendline. The daily chart showcasing candles with lower price rejections indicates the traders continue to witness buying pressure which may push the price higher.
This bullish reversal will prolong the ongoing consolidation for a few more days before the price gives a breakout.
As the bearish pattern is a bearish continuation structure, the MATIC price is more likely to breach the lower support trendline. A daily candle closing below the mentioned trendline will offer a short-selling opportunity and may tumble the prices 15% down to hit $0.945 support.
On a contrary note, a bullish breakout from the overhead trendline will undermine the bearish thesis and signal an early sign for trend reversal.
Technical Indicators
Exponential Moving Average: the flattish daily EMAs(20, 50, 100, and 200) highlight an ongoing sideways trend.
Relative Strength Index: The daily RSI slope with the same high formation projects rising buying pressure within the consolidation phase and adds more confirmation upside trendline breakout.
MATIC Coin Price Intraday Levels
- Spot rate: $1.09
- Trend: Bearish
- Volatility: High
- Resistance levels- $1.17 and $1.3
- Support levels- $1.042 and $0.945

Why Trust CoinGape
CoinGape has covered the cryptocurrency industry since 2017, aiming to provide informative insights Read more…to our readers. Our journal analysts bring years of experience in market analysis and blockchain technology to ensure factual accuracy and balanced reporting. By following our Editorial Policy, our writers verify every source, fact-check each story, rely on reputable sources, and attribute quotes and media correctly. We also follow a rigorous Review Methodology when evaluating exchanges and tools. From emerging blockchain projects and coin launches to industry events and technical developments, we cover all facets of the digital asset space with unwavering commitment to timely, relevant information.

Related Articles


- Solana Mobile’s SKR Token Launches Jan. 21: What to Know About the Seeker Airdrop
- Breaking: XRP Spot Trading Goes Live on Hyperliquid via Flare’s FXRP
- Bitcoin Falls Despite U.S. JOLTS Job Openings Missing Expectations
- JPMorgan To Expand JPM Coin to Canton Network After Launch on Coinbase’s Base
- Stablecoins Gain Infrastructure Boost as Morph Backs Startups with $150M
- XRP vs Solana Price: Which Could Outperform in January 2026?
- Meme Coin Price Prediction For Jan 2026: Dogecoin, Shiba Inu And Pepe Coin
- Pi Coin Price Eyes Rebound to $0.25 as Top Whale Nears 400M Milestone
- Ethereum Price Prediction Ahead of US data Report
- Bitcoin Price Prediction as FOMC Nears: Will 90% No-Cut Probability Pressure BTC?
- Dogecoin Price Outlook as Futures Open Interest Nears $2B: What Next for DOGE?


