 Buy Presale
MATIC Price Revisits Key $0.5 Support: A Turning Point or Caution Zone?


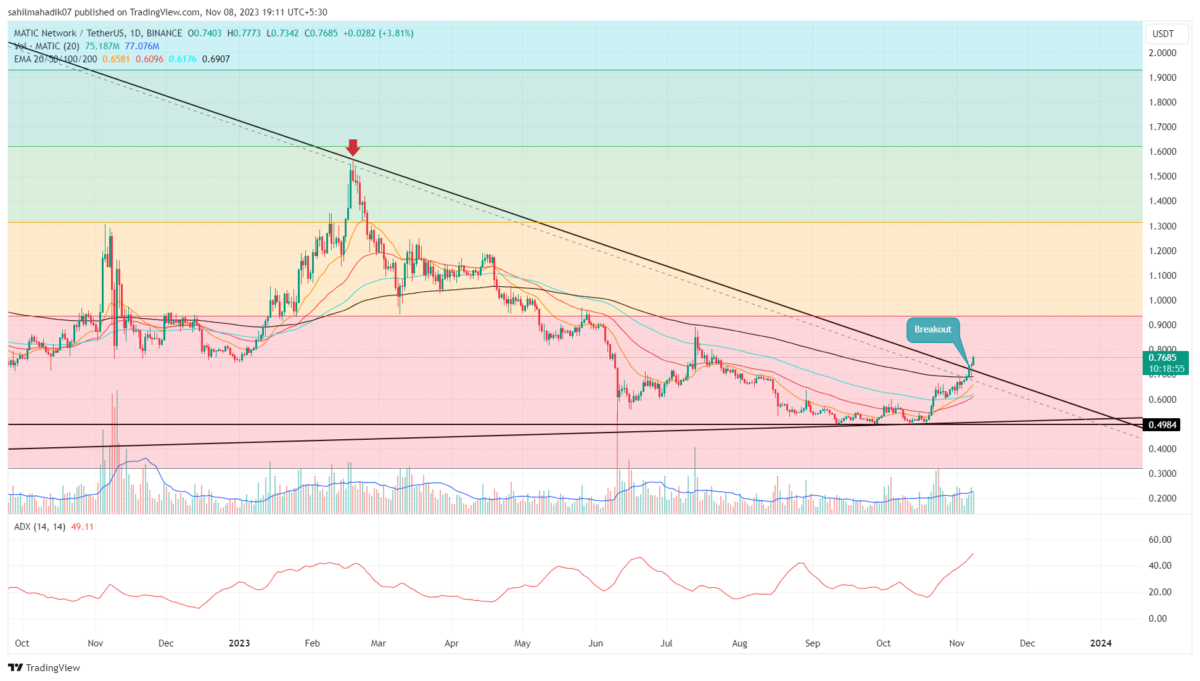
In the daily timeframe, the MATIC price reveals a narrative of resilience amid prevailing bearish undertones. After a period of descent, the coin’s trajectory appears to be stabilizing, finding substantial buying pressure around the key $0.5 support. This rising demand is validated by an ascending trendline linking two higher lows, giving rise to a symmetrical triangle pattern. This technical formation typically acts as a crucible for future price movements, making it a potent tool for traders.
Also Read: MATIC Price Prediction As Polygon 2.0 Prepares To Come To Life – Breakout In The Offing?
Triangle Pattern Threatens Prolong Correction
- In response to triangle pattern formation, the MATIC price prolongs sideways action
- Demand pressure at the support trendline hints at a 10% upswing ahead
- The intraday trading volume of the MATIC coin is $226 Million, showing a 13% loss.
 Source- Tradingview
Over the past seven weeks, the polygon coin price dynamics have been largely dominated by the triangle pattern, rebounding from the upper boundary twice and the lower one thrice. Currently trading at $0.51, the polygon coin has once again demonstrated demand pressure by bouncing off the lower trendline with the formation of a long-tail rejection candle.
Under the influence of this pattern, the newfound demand pressure may lead to a 10% ascent to challenge the upper boundary. Nevertheless, as the constricting boundaries of the triangle remain unbreached, a continuation of the sideways momentum is likely, casting a shadow of uncertainty.
Traditionally, the symmetrical triangle tends to favor the trend leading into its formation, which, in the current case, is bearish. This implies a potential downward break, breaching the triangle’s lower trendline and the critical $0.5 psychological support.
Should the bears cement their hold with a decisive daily candle close below the pattern, it might catalyze a more profound 18% dip, targeting the $0.422 zone.
[converter id=”matic-polygon” url=”https://coingape.com/price/converter/polygon-to-usd/?amount=1″]
Is MATIC Price Ready for a Recovery Trend?
While the short-term projection for MATIC price seems sideways to bearish, a possible breakout from the pattern’s upper trendline could change the market sentiment. This breakout will provide buyers with support to lead a price rally to a combined resistance of $0.64 and a long-coming resistance trendline. The ongoing downtrend in the coin can be followed by this trendline and thus, its breakout is crucial for trend change.
- Bollinger Band: A lateral movement in the Bollinger band indicator accentuates a sideways action in play.
- Relative Strength Index: Despite the increasing buying pressure evident by the rising RSI slope, the MATIC price gives a lower high formation indicating that the current bullish momentum isn’t enough.
Play 10,000+ Casino Games at BC Game with Ease
- Instant Deposits And Withdrawals
- Crypto Casino And Sports Betting
- Exclusive Bonuses And Rewards


Why Trust CoinGape
CoinGape has covered the cryptocurrency industry since 2017, aiming to provide informative insights Read more…to our readers. Our journal analysts bring years of experience in market analysis and blockchain technology to ensure factual accuracy and balanced reporting. By following our Editorial Policy, our writers verify every source, fact-check each story, rely on reputable sources, and attribute quotes and media correctly. We also follow a rigorous Review Methodology when evaluating exchanges and tools. From emerging blockchain projects and coin launches to industry events and technical developments, we cover all facets of the digital asset space with unwavering commitment to timely, relevant information.
24 Hours volume
$102.32K
Market Cap
$217.76M
Max Supply
10B

Related Articles


- Ripple Bets On AI Boom With Strategic Investment In AI Agent Infrastructure Startup
- Prediction Market News: Kalshi Fines MrBeast Associate Over Insider Trading Amid State Crackdown
- CLARITY Act: Banks, Crypto Yet To Agree On New Crypto Bill Draft As March 1 Deadline Looms
- Michael Saylor Predicts $50T From Bonds Could Flow Into Bitcoin Ecosystem as Digital Credit Evolves
- Bitcoin Treasury Firm GD Culture Authorizes Sale of 7,500 BTC as Expert Warns Of More ‘Pain’
- Dogecoin, Cardano, and Chainlink Price Prediction As Crypto Market Rebounds
- Will Solana Price Rally to $100 If Bitcoin Reclaims $72K?
- XRP Price Eye $2 Rebound as On-Chain Data Signals Massive Whale Accumulation
- Ethereum Price Reclaims $2K- New Rally Ahead or a Temporary Bounce?
- COIN Stock Price Prediction as Wall Street Pros Forecast a 62% Surge
- Cardano Price Signals Rebound as Whales Accumulate 819M ADA


