 Buy $GGs
MultiversX Price Prediction: What’s Next For $EGLD After 40% Jump?


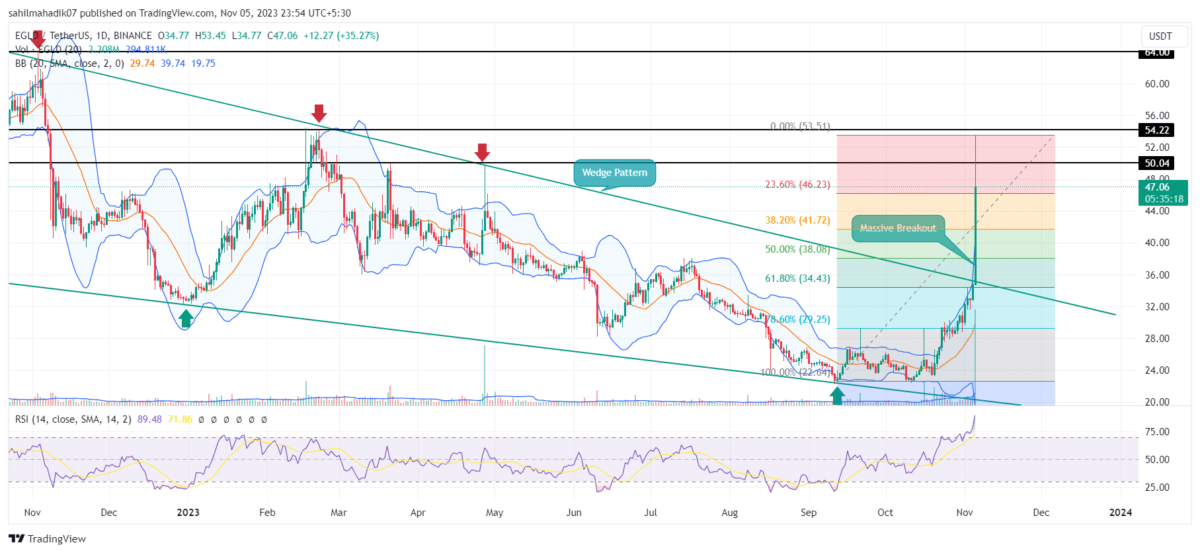
MultiversX Price Prediction: In the span of the last 16 months, the MultiversX coin has traced a shallow but gradual decline within a falling wedge pattern, a classic configuration in technical analysis that often signals bullish reversals. The EGLD price bounced off the upper boundary four times and the lower boundary three times, affirming the pattern’s significance in shaping market movements. Today, a 40% single-day surge represents a pivotal breakout from this pattern, heralding a shift in sentiment and hinting at a potential trend reversal for Elrond.
Also Read: Is It Altcoin Season? Top Performing Altcoins This Week As Bitcoin Price Holds $35K
Will the Recovery Trend Continue?
- The falling wedge pattern formation reflects the weakening of bear momentum and pontential for market change. downtrend reflect
- The overhead supply at $50 may trigger a minor pullback.
- The intraday trading volume in EGLD is $886.5 Billion, indicating a 225c6% gain.
 Source- Tradingview
The MultiversX coin price entered into a recovery state in the fourth week of October when the price rebounded from the low of $23.24. So far, the bullish rally has reported a 103% gain as the price reached the current trading price of $47.2.
A large portion of this upsurge—marked by a pronounced 40% leap in market valuation today, imprinting a dominant bullish candlestick on the daily chart. This surge not only pierced through the resistance of the enduring falling wedge pattern but also signaled a possible transition toward a bullish phase.
Currently, the EGLD price encounters resistance at the psychological level of $50, an anticipated outcome as short-term traders likely capitalize on profits. However, following the principles of a falling wedge, the upswings retest the downsloping trendline are pontential targets of the current recovery.
Thus, with sustained buying the EGLD price is likely to hit at $54, followed by $64 and then $70.
Will EGLD Price Lose $40 Mark?
Despite the prevailing bullish sentiment, resistance at the $50 level could instigate a brief retracement. According to Fibonacci retracement levels, the buyers may find suitable support at $46, $41.6, and $38. The bullish trend is considered secure as long as EGLD’s price is maintained above the $38 mark, corresponding to the 50% Fibonacci level.
- Bollinger Band: A sharp uptick in the upper boundary of the Bollinger Bands reflects the aggressive buying momentum in the market.
- Relative Strength Index: The daily RSI slope at the overbought regio 90% reflects the need for a minor pullback before the next leap.
Play 10,000+ Casino Games at BC Game with Ease
- Instant Deposits And Withdrawals
- Crypto Casino And Sports Betting
- Exclusive Bonuses And Rewards


Why Trust CoinGape
CoinGape has covered the cryptocurrency industry since 2017, aiming to provide informative insights Read more…to our readers. Our journal analysts bring years of experience in market analysis and blockchain technology to ensure factual accuracy and balanced reporting. By following our Editorial Policy, our writers verify every source, fact-check each story, rely on reputable sources, and attribute quotes and media correctly. We also follow a rigorous Review Methodology when evaluating exchanges and tools. From emerging blockchain projects and coin launches to industry events and technical developments, we cover all facets of the digital asset space with unwavering commitment to timely, relevant information.
MultiversX (Elrond)
24 Hours volume
$7.77M
Market Cap
$132.89M
Max Supply
31.42M

Related Articles


- Breaking: U.S. PPI Inflation Rises To 2.9%, BTC Price Falls
- XRP News: Ripple-Backed Ctrl Alt Completes $280M in Diamond Tokenization on XRPL
- Bitwise CIO Calls Bitcoin Selloff ‘Classic Cycle,’ Dismisses Manipulation Rumors
- Cardone Capital Takes Real Estate On-Chain With $5B Tokenization Plan
- Senator Elizabeth Warren Targets Trump-Affiliated World Liberty Financial Over Bank Charter Bid
- Top 2 Price Predictions Ethereum and Solana Ahead of March 1 Clarity Act Stablecoin Deadline
- Pi Network Price Prediction Ahead of Protocol Upgrades Deadline on March 1
- XRP Price Outlook As Jane Street Lawsuit Sparks Shift in Morning Sell-Off Trend
- Dogecoin, Cardano, and Chainlink Price Prediction As Crypto Market Rebounds
- Will Solana Price Rally to $100 If Bitcoin Reclaims $72K?
- XRP Price Eye $2 Rebound as On-Chain Data Signals Massive Whale Accumulation


