 Buy $GGs
Near Protocol Analysis: Bulls Coils Up Toward $6.0; Is Correction On the Way?


Near protocol, analysis indicates a bullish outlook in the token. However, for the past three sessions, the pair consolidates near the higher levels. As of writing, NEAR/USD is reading at $5.89, with 9.75% gains. The token is ranked 23rd as per its market capitalization.
According to CoinMarkerCap data, the 24-hour trading volume of the coin rose more than 45% to $748,78,145. A rising price with rising volumes indicates a bullish sign.
- Near Protocol trades higher following the previous session’s downside movement.
- If the price continues to oscillate near 3-month highs, a corrective pullback is possible.
- A daily candlestick below $5.16 could invalidate the bullish outlook.
Currently, the NEAR price is making bullish moves. The technical indicators of Near protocol are poised to enter the overbought market structure on the daily time frame.
Near price extends consolidation near the higher level
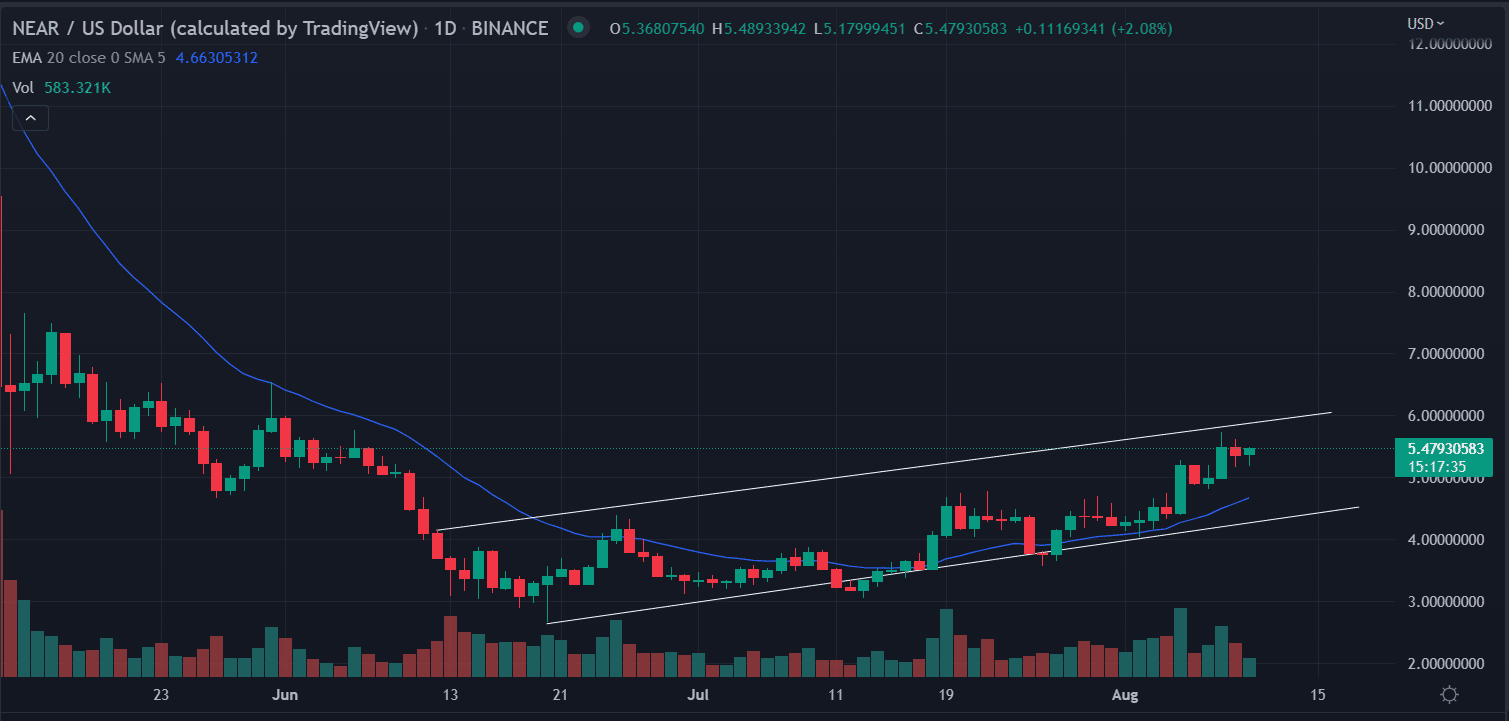
The daily technical chart of the Near protocol indicates that the bulls are struggline near the $5.70 and $5.50 resistance zone. The formation of two consecutive doji candlestick hints at a corrective pull back in the price.
Near is trading inside a rising price channel from the lows of $3.03. Recently, the price completed the rounding bottom formation near $5.50. All this sums up for a minor correction, which is a prerequtise for an explosive expansion toward $8.0 level.
The RSI (14) is above the average line with a bullish tilt. It reads at 65, near to the overbought market zone. But in a strong trend, the oscillator could mislead.
For the last two days, the price is trading inside a bullish green candle, as shown in charts, forming inside Bar Pattern. The inside bar is a popular continuation candle formation that only requires two candles to present itself.
A shift in the bearish sentiment the NEAR price could test Tuesday’s low of $4.90.
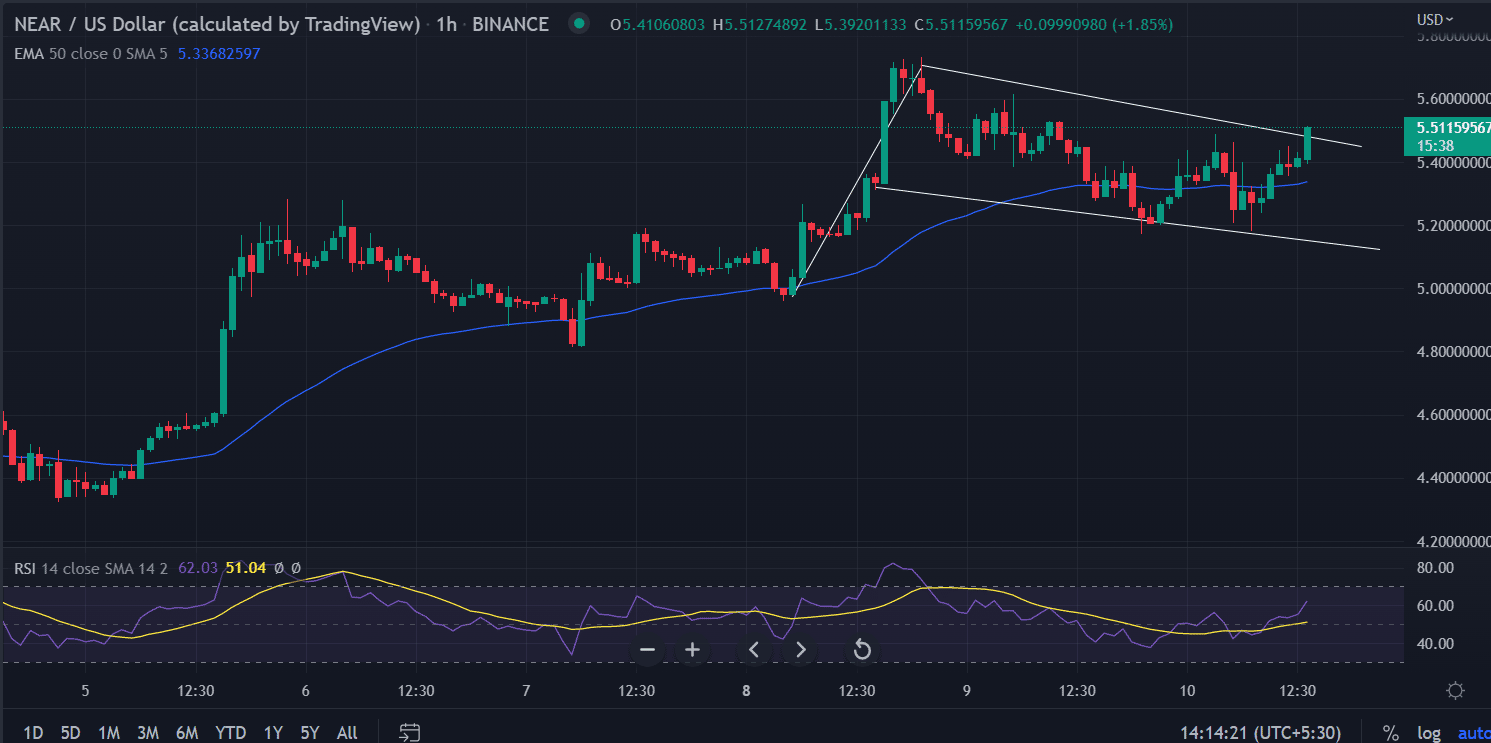
On the hourly time frame, the Near protocol price formed a “Flag” formation. The pole is created at the lows of $4.96 on August 8, after testing the swing highs of $5.73 the price entered in to a consolidation.
The same pattern formed on August 5, the price rallied more than 20% in two-day.
Also read: https://coingape.com/breaking-btc-eth-skyrockets-as-inflation-data-shows-cooling-economy/
We expect the price to test the 20-day exponential moving average (EMA) at $5.34. This could be a base for the breakout to the higher side.
A trade above the $5.60 level on the hourly time frame would strengthen the bullish bias in the token. On moving higher the price could meet $5.80 followed by the psychological $6.0 level.
Conclusion:
Any retracement in the Near protocol price could a dip-buying opportunity for side lined investors.
Play 10,000+ Casino Games at BC Game with Ease
- Instant Deposits And Withdrawals
- Crypto Casino And Sports Betting
- Exclusive Bonuses And Rewards


Why Trust CoinGape
CoinGape has covered the cryptocurrency industry since 2017, aiming to provide informative insights Read more…to our readers. Our journal analysts bring years of experience in market analysis and blockchain technology to ensure factual accuracy and balanced reporting. By following our Editorial Policy, our writers verify every source, fact-check each story, rely on reputable sources, and attribute quotes and media correctly. We also follow a rigorous Review Methodology when evaluating exchanges and tools. From emerging blockchain projects and coin launches to industry events and technical developments, we cover all facets of the digital asset space with unwavering commitment to timely, relevant information.

Related Articles


- BREAKING: Iran Refutes WSJ’s Claims on Push to Resume Nuclear Talks with US, Bitcoin Slips
- Crypto Market Crash Deepens as Trump Confirms More Airstrikes to Hit Iran
- US CLARITY Act Likely to Pass by Mid-Year, JPMorgan Signals Major Crypto Shift
- Crypto Market Update: Top 3 Reasons Why BTC, ETH, XRP and ADA is Up
- Crypto News: Bitcoin Sell-Off Fears Rise as War Threatens Iran’s BTC Mining Operations
- Bitcoin And XRP Price As US Kills Iran Supreme Leader- Is A Crypto Crash Ahead?
- Gold Price Prediction 2026: Analysts Expect Gold to Reach $6,300 This Year
- Circle (CRCL) Stock Price Prediction as Today is the CLARITY Act Deadline
- Analysts Predict Where XRP Price Could Close This Week – March 2026
- Top Analyst Predicts Pi Network Price Bottom, Flags Key Catalysts
- Will Ethereum Price Hold $1,900 Level After Five Weeks of $563M ETF Selling?


