 Buy $GGs
NEAR Protocol Price Analysis: Bulls Aims To Reclaim $6.0 Amid Sustained Buying


NEAR Protocol price analysis implies buying with limited price action. The bulls attempt the hold the key support area following the previous session’s downside momentum.
NEAR price consolidates near the short-term support area that extends from May. A break above or below this level would set the next directional bias for the token. However, odds appeared to be leaning in the favor of the bulls.
- NEAR Protocol struggles to sustain gains at $5.00.
- A retest of the critical breakout zone admits strength in the price.
- A daily candlestick above $5.20 could strengthen the bullish bias.
Is NEAR Protocol able to pull back?
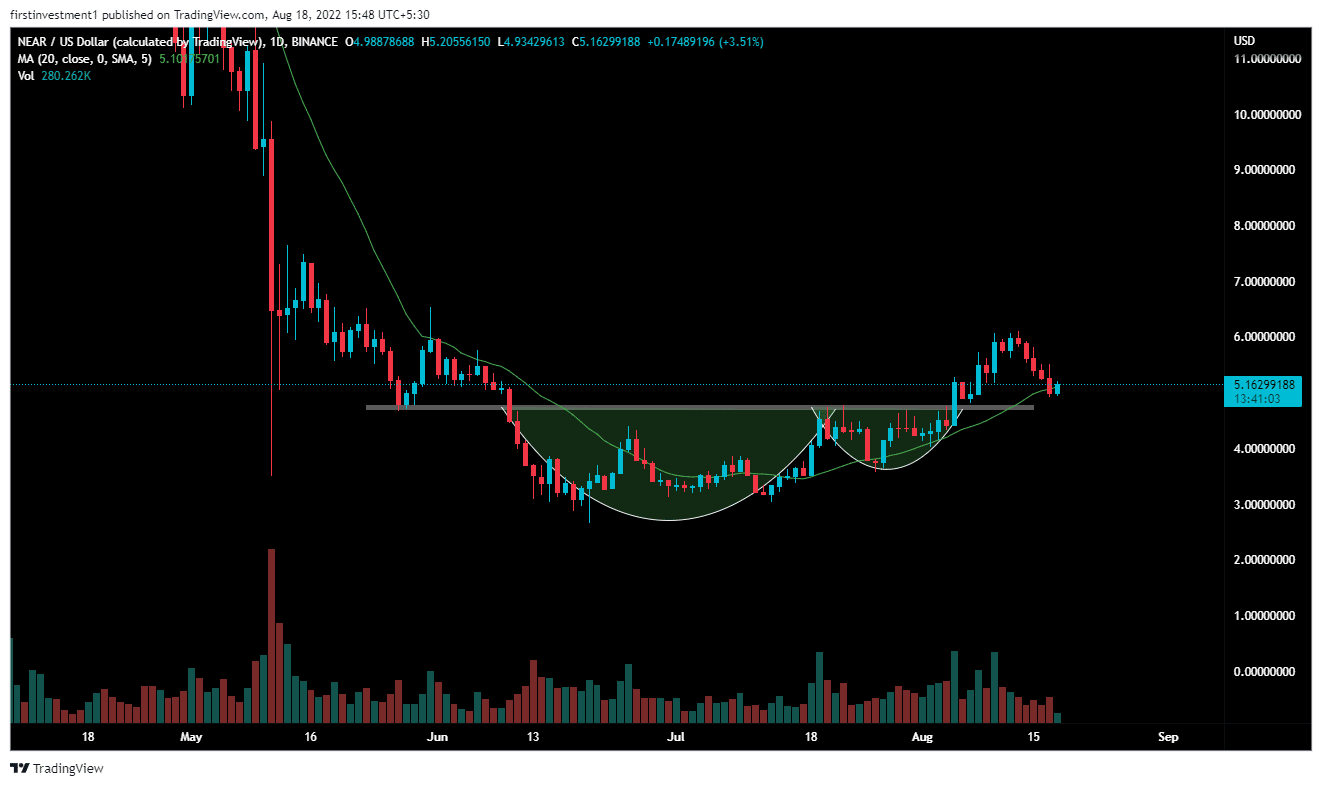
On the daily chart, the NEAR Protocol analysis gives a bullish view.
The price is making higher highs and higher lows. However, recently price gave an impulse move from $4.02 to $6.11, with more than 50% upside gains from the lows, showing great strength.
Further, the NEAR/USD gave a breakout of the “Cup & Handle pattern” on August 5. After making swing highs at $6.11 the asset formed a rounded top, which is now coming for a retracement at the breakout level. This also coincides with the 20-day exponential moving average at $5.12.
In the previous session, the price closed below 20 EMA, but additional buying pressure pushed the price above the critical level. A daily close above the session’s high at $5.20 would invite fresh entries toward the higher side. On moving higher, the bulls could aim at the psychological $6.00 level.
To push the price above the supply zone more buyers’ participation is a prerequisite. We expect the price to test $8.0 amid sustained buying pressure.
On the contrary, a break below $4.90 on the daily basis would make bears hopeful.
The 4-hour chart looks for the upside
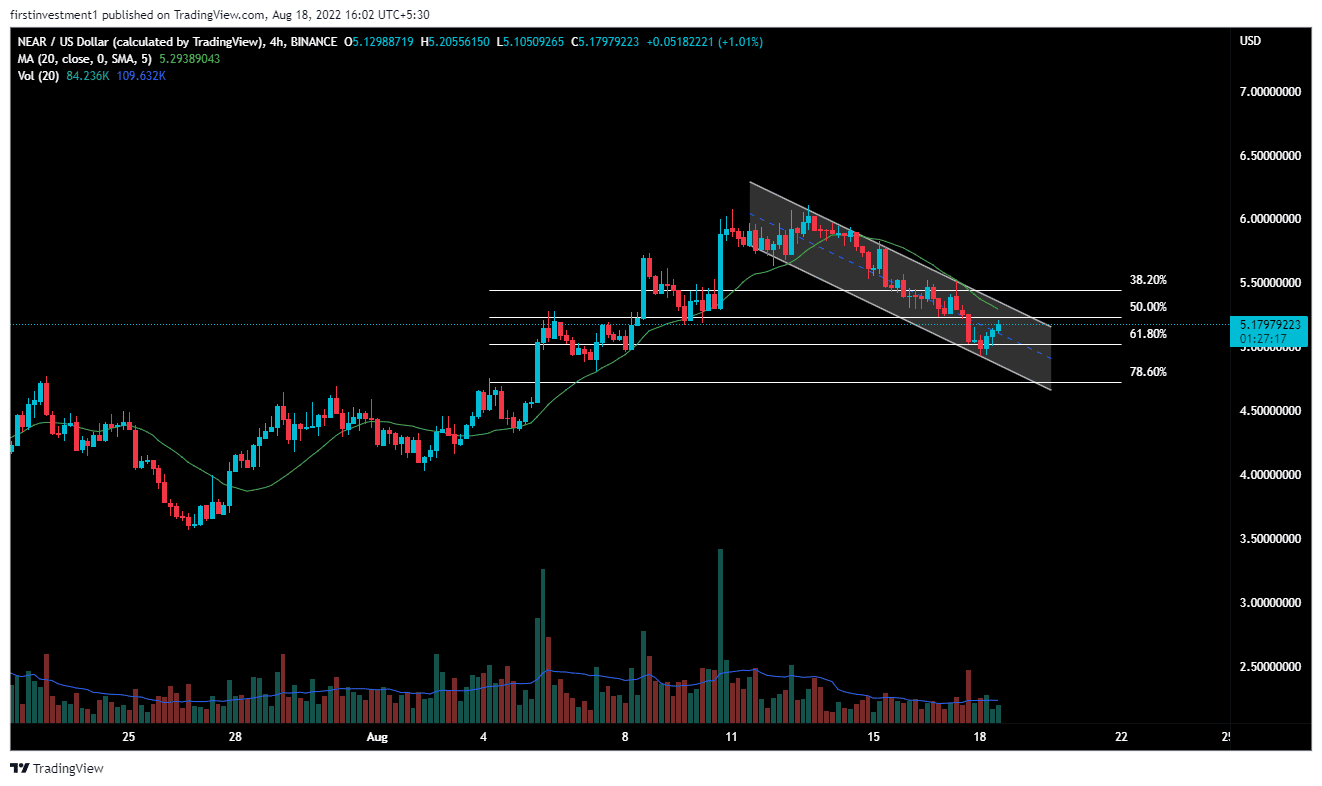
On the four-hour chart time frame, the price is taking a retracement at 61.8% Fibonacci retracement level, which is also known as the golden retracement ratio.
If the price managed to bounce back from this ratio, then we expect the bullish trend to continue.
Also read: Breaking: Ethereum Developers Completes All Preparations For The Merge
In addition, a “Flag and Pole” pattern also gives an upside signal. According to this pattern, if the price closes above $5.20, then we can expect a good bullish momentum of up to $6.0.
On the other hand, a break below the $4.90 level could invalidate the bullish outlook. And the price can go below $4.40.
NEAR is bullish on all time frames. Above $5.20 closing on the hourly time frame, we can put a trade on the buy side.
As of publication time, NEAR/USD is reading at $5.05, up 1.16% for the day. NEAR Protocol sits at number 23 as per the market capitalization. The trading volume declined more than 14% to $300,889,129 in the past 24-hour as per the CoinMarketCap data.
Play 10,000+ Casino Games at BC Game with Ease
- Instant Deposits And Withdrawals
- Crypto Casino And Sports Betting
- Exclusive Bonuses And Rewards


Why Trust CoinGape
CoinGape has covered the cryptocurrency industry since 2017, aiming to provide informative insights Read more…to our readers. Our journal analysts bring years of experience in market analysis and blockchain technology to ensure factual accuracy and balanced reporting. By following our Editorial Policy, our writers verify every source, fact-check each story, rely on reputable sources, and attribute quotes and media correctly. We also follow a rigorous Review Methodology when evaluating exchanges and tools. From emerging blockchain projects and coin launches to industry events and technical developments, we cover all facets of the digital asset space with unwavering commitment to timely, relevant information.

Related Articles


- XRP News: Ripple Expands Payments Platform To Unify Fiat and Stablecoins Globally
- U.S.–Iran War: Bitcoin Price Extends Decline as Oil Prices Surge To Two-Year High
- Bitcoin Treasury Firm MARA Considers Selling BTC Reserves After Policy Update
- Cardano Founder Warns Over CLARITY Act, Cites Lack of Protection for DeFi, Stablecoins, Prediction Markets
- Core Scientific Sells 1,900 BTC as Bitcoin Miner Pivots to AI, CORZ Stock Dips
- RIOT Stock Prediction as Needham, Piper Sandler Slash Target After Earnings
- Cardano Price Outlook As Charles Hoskinson Warns Over CLARITY Act
- Circle Stock Price Climbs 15% to $96, Can Rally Continue in March 2026?
- Bitcoin Price Prediction as US-Iran War Enters 4th Consecutive Day
- Top 5 Historical Reasons Dogecoin Price Is Not Rising
- Pi Coin Price Prediction for March 2026 Amid Network Upgrade, KYC Boost, Rewards Distribution


