NEAR Protocol Price Surges 37% as Open Interest Jumps 59% — Is $5 the Next Target?


Highlights
- NEAR Protocol price nears breakout as buyers dominate after months of accumulation.
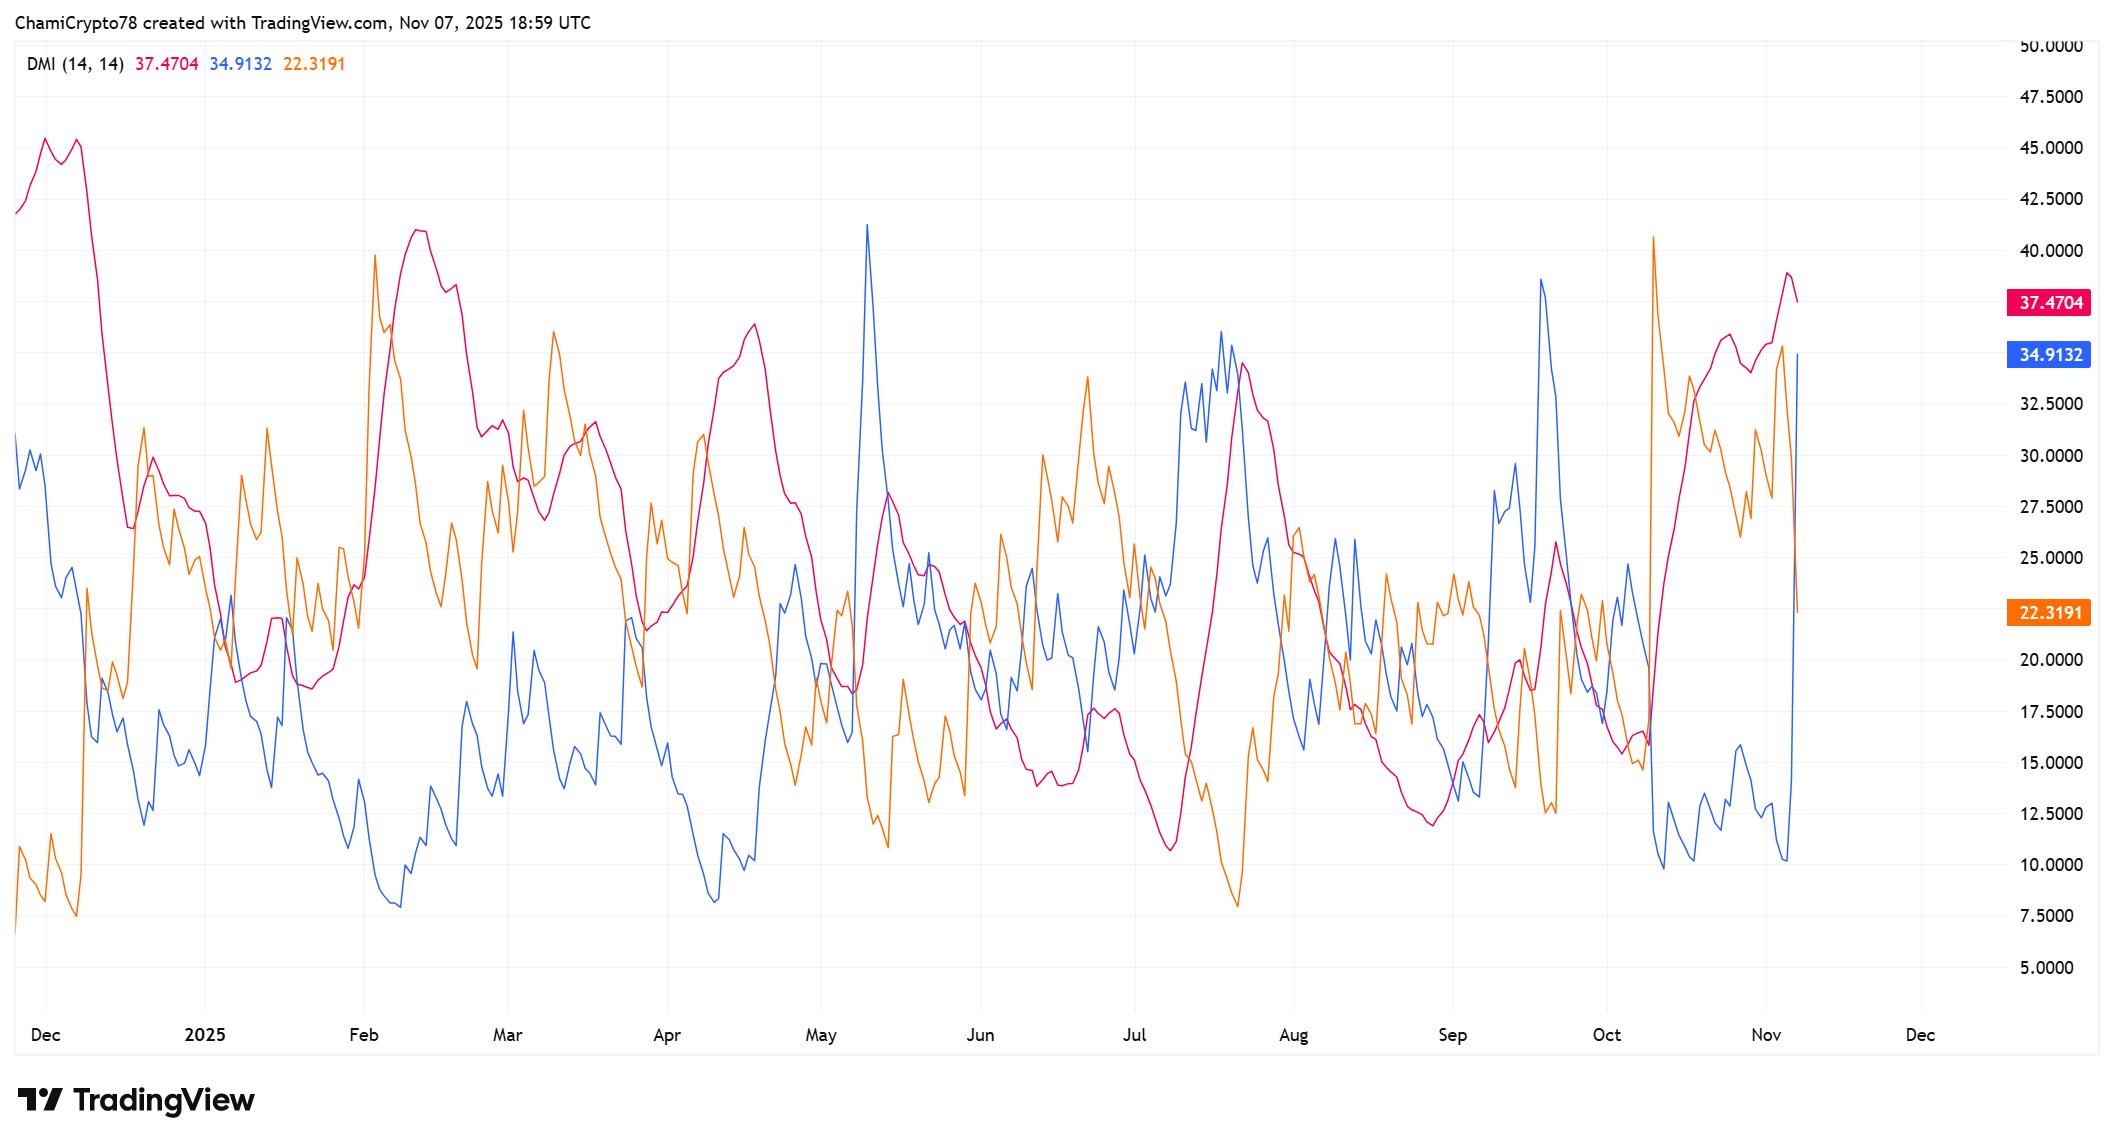
- DMI indicator confirms bullish control with ADX strengthening near 37.
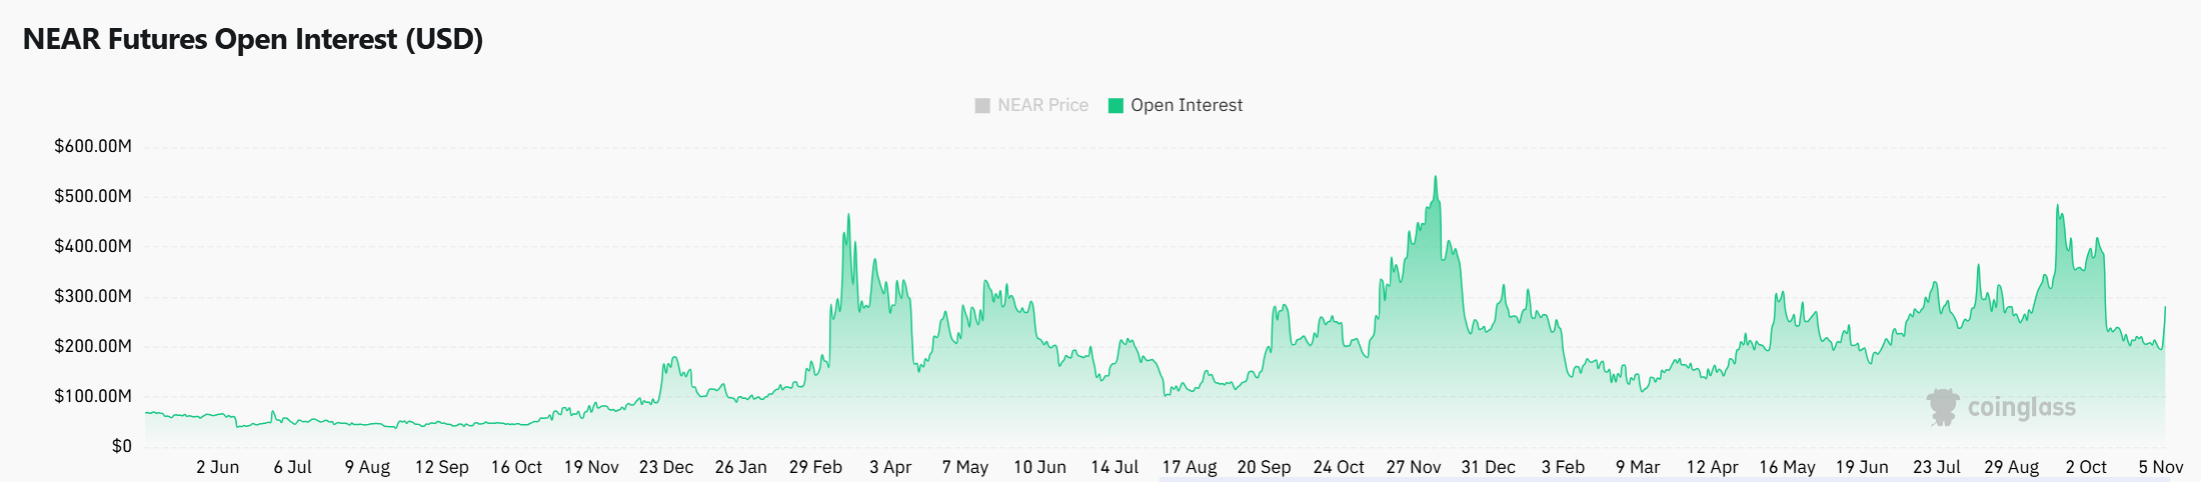
- Open Interest rises 59% to $419M, signaling deeper participation and capital inflow.
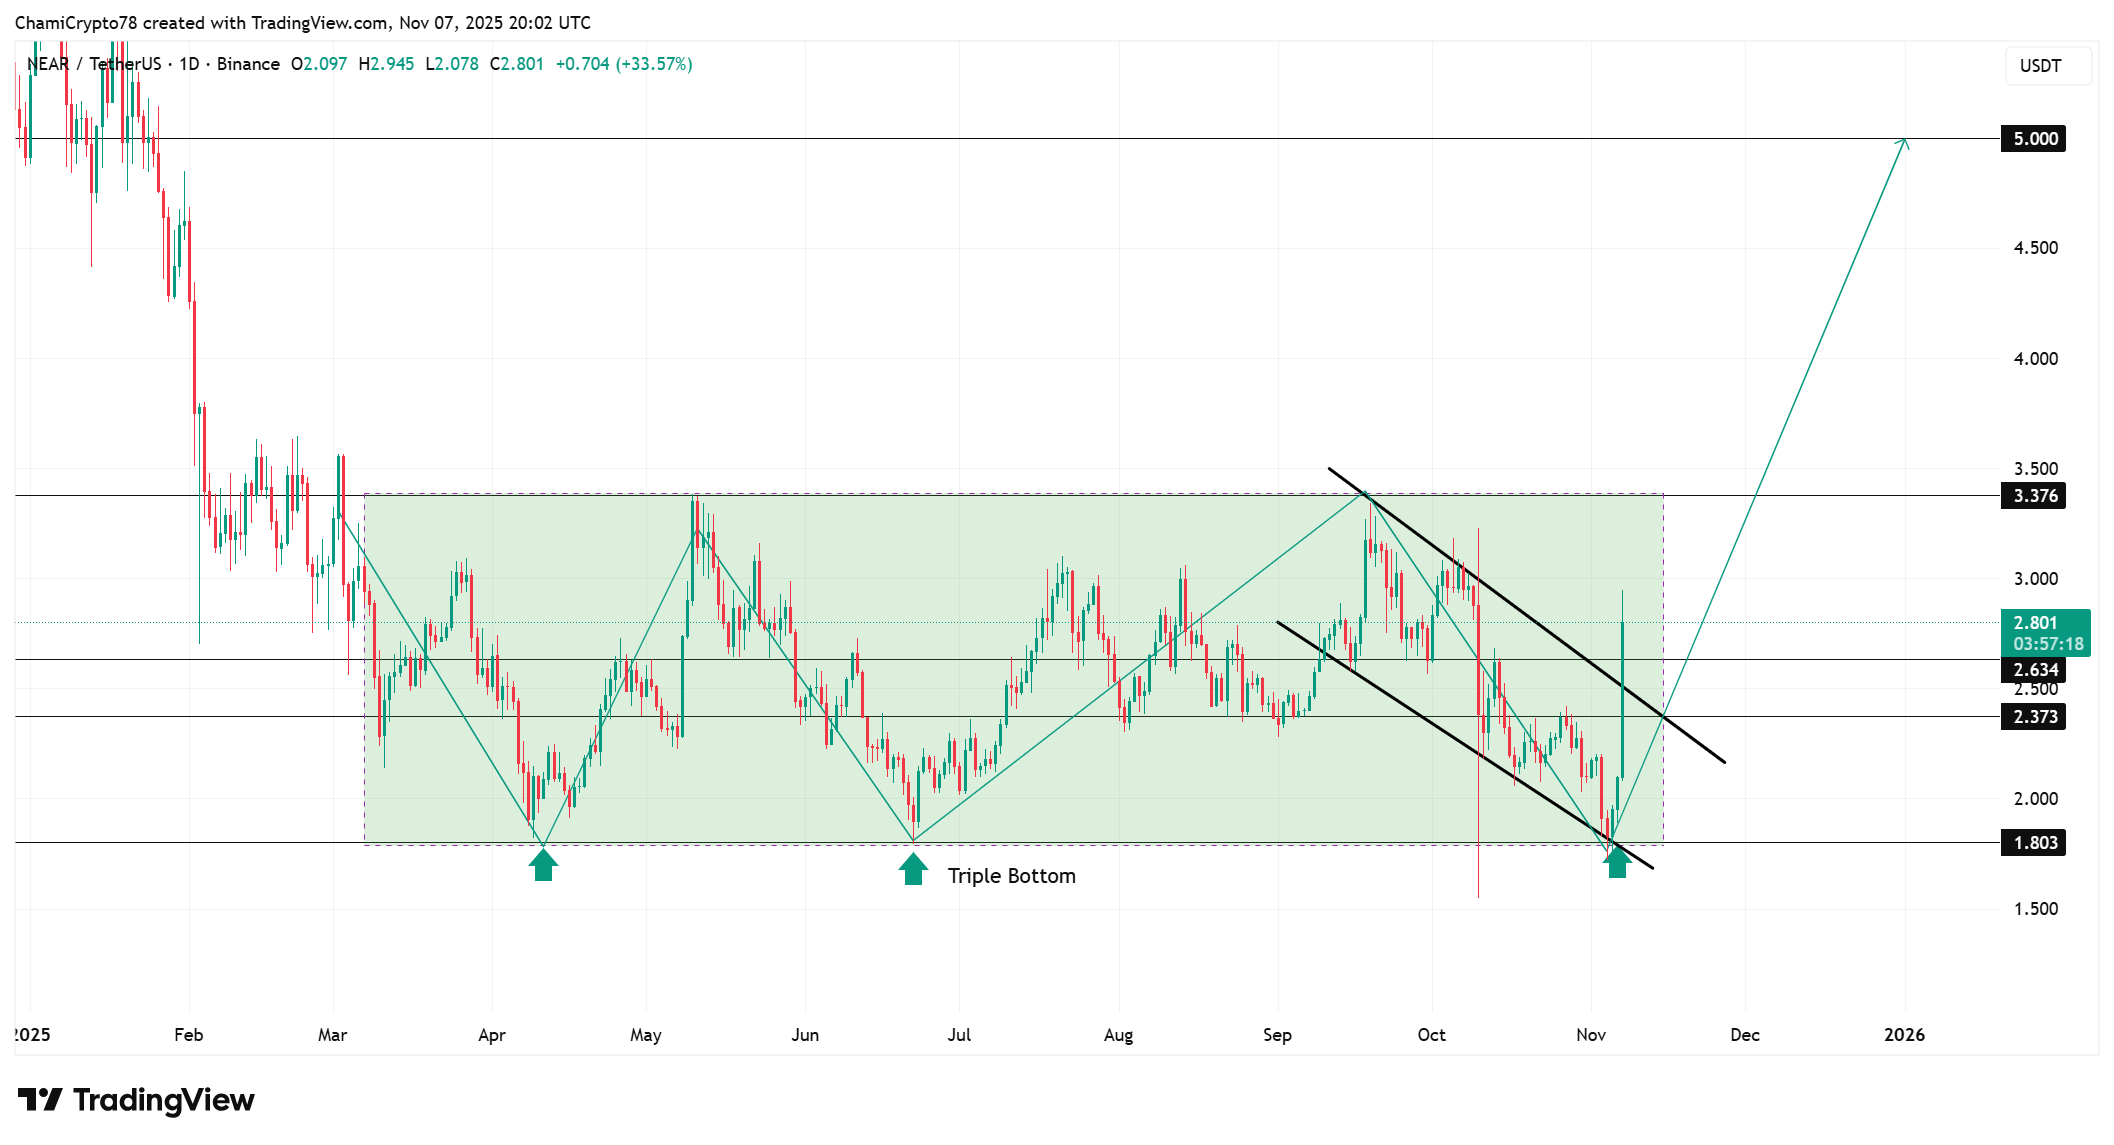
The NEAR Protocol price trades at $2.80, rising 37% in the past 24 hours as buyers reclaim control after months of indecision. The climb is an indication of regained strength in the market as NEAR heads to a vital resistance at 3.37. The Open Interest has shot up by a significant margin. This validates an increase in leveraged interests and capital inflows. A breakout above $3.37 with steady accumulation would prove a complete structural change to the target of $5.
NEAR Protocol Price Action Shows Buyers Regaining Ground as Breakout Nears
The NEAR Protocol price is nearing a breakout from an eight-month consolidation phase that has kept it range-bound between $1.80 and $3.37 since March. In this time, the sellers have stalled upward movements at the upper limit severally. On the other hand, the buyers have been strengthening their defense at the $1.80 base, confirming a triple bottom rebound.
The recent upward shift beyond the downward channel that is within the range indicates a shift in the market. The present NEAR value is quoted at $2.80, which indicates a high buyer momentum and increasing desire to break the upper resistance.
The 2.40-2.63 zone is now one of the most important support layers where the short-term selling is always absorbed by the demand. This level has shifted to resistance to accumulation level and provided the buyers with a stable platform to push higher.
The triple bottom formation at around $1.80 was a good reversal base, which indicated that the sellers no longer have their former advantage.
Breaking out of the consolidation and into a new upward cycle will be proven by a daily close above $3.37. Eventually, the close will indicate that NEAR has broken out of the consolidation and is in a new upward cycle. This would put $5 as a realistic continuation target as the bullish confidence grows in all timeframes.
DMI Indicator Strengthens Long-Term NEAR Price Projections
The DMI indicator also confirms the strength behind the recovery of NEAR price. The +DI line has soared sharply up above the -DI, which proves the dominance of the buyers, and the ADX is around 37. This is usually the point of transition between the consolidation and the continued growth of the trend.
The increasing ADX indicates that the present uptrend is not a mere short-term volatility but has the real strength. At the same time, the distance between +DI and -DI is expanding, which indicates the growing momentum of buyers.
These readings support long-term NEAR price projections, indicating that the current structure is capable of supporting extended growth. The steady volume and directional force implies that NEAR might continue its progress as the accumulation proceeds to greater levels.
Open Interest Expansion Confirms Strong Derivatives Backing
According to CoinGlass, open interest has increased by 59% to approximately $419 million, supporting the validity of NEAR upward structure. The growth indicates new long positions in the market, which proves that the trend is not liquidation-based.
This increased derivatives activity is a reflection of increased demand in spot markets and it has brought about a balanced power on both fronts. The liquidity has also become deeper and thus the rally is moving forward with fewer sudden reversals.
With the long positions growing with the stable price action, the confidence in the current rally continues to grow. Maintaining the level of strength beyond 2.60 will ensure the market is on track towards greater growth, and NEAR price will be in a position to directly move towards the 5 mark when it breaks the resistance.
Conclusively, the NEAR Protocol price is approaching a decisive moment as it nears the top of its long consolidation range. The lower and midrange zones are now dominated by buyers with the help of increasing open interest and more powerful trend signals provided by the DMI. The accumulation of demand to close to $2.60 is an indication of long-term accumulation and increasing belief by investors. A clean break above 3.37 would solidify the long awaited breakout and put NEAR price on a straight track towards the 5 target.
Frequently Asked Questions (FAQs)
1. What does the DMI indicator reveal about NEAR’s market trend?
2. How long has NEAR been consolidating before this rally?
3. Why is Open Interest important for NEAR investors?

Why Trust CoinGape
CoinGape has covered the cryptocurrency industry since 2017, aiming to provide informative insights Read more…to our readers. Our journal analysts bring years of experience in market analysis and blockchain technology to ensure factual accuracy and balanced reporting. By following our Editorial Policy, our writers verify every source, fact-check each story, rely on reputable sources, and attribute quotes and media correctly. We also follow a rigorous Review Methodology when evaluating exchanges and tools. From emerging blockchain projects and coin launches to industry events and technical developments, we cover all facets of the digital asset space with unwavering commitment to timely, relevant information.

Related Articles


- XRP Realized Losses Spike to Highest Level Since 2022, Will Price Rally Again?
- Crypto Market Rises as U.S. and Iran Reach Key Agreement On Nuclear Talks
- Trump Tariffs: U.S. Raises Global Tariff Rate To 15% Following Supreme Court Ruling
- Bitwise CIO Names BTC, ETH, SOL, and LINK as ‘Mount Rushmore’ of Crypto Amid Market Weakness
- Prediction Market News: Kalshi Faces New Lawsuit Amid State Regulatory Crackdown
- Dogecoin Price Prediction Feb 2026: Will DOGE Break $0.20 This month?
- XRP Price Prediction As SBI Introduces Tokenized Bonds With Crypto Rewards
- Ethereum Price Rises After SCOTUS Ruling: Here’s Why a Drop to $1,500 is Possible
- Will Pi Network Price See a Surge After the Mainnet Launch Anniversary?
- Bitcoin and XRP Price Prediction As White House Sets March 1st Deadline to Advance Clarity Act
- Top 3 Price Predictions Feb 2026 for Solana, Bitcoin, Pi Network as Odds of Trump Attacking Iran Rise


