 Buy $GGs
Pepe Coin Price Prediction As Repetitive Pattern Signals Another 15% Drop


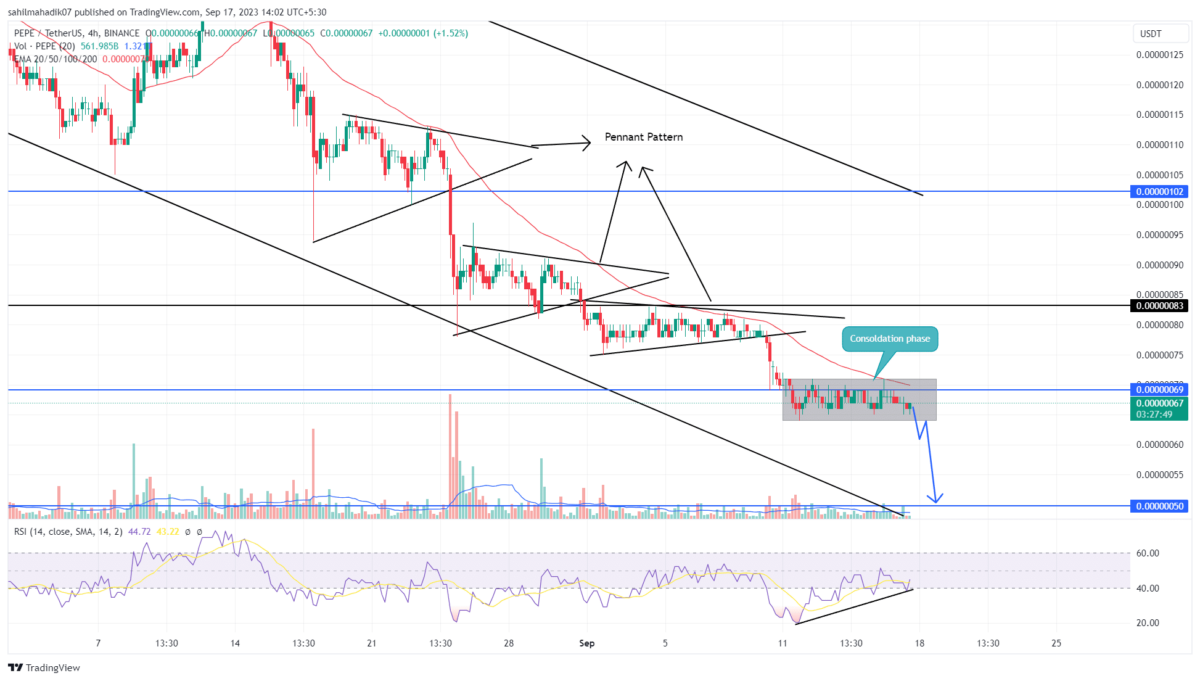
In response to recent reversal sentiment in the crypto market, the falling Pepe coin price has turned sideways after hitting a low of $0.00000064. This consolidation showed six short-bodied daily candles with rejection on either side indicating no initiation from buyers or sellers. Interestingly, this lateral phase is confined within the range of the September 11th candle, creating a narrow range formation. Here’s how this pattern could further influence the future projection of the Pepe price.
Also Read: Will Market Reversal Push Pepe Coin Recovery Above $0.0000008?
Is a Downfall Imminent for Pepe Coin?
- The Pepe price consolidation in a narrow range creates a no-trading zone.
- A bearish breakdown from the $0.00000064 support could set the price for a 15% drop
- The 24-hour trading volume in the Pepe coin is $27.2 Million, indicating a 32% loss.

Source- Tradingview
Starting from the August 14th high of $0.00000147, the PEPE token is under a steep correction. This downtrend resulted in a massive 56% price erosion in just a month, bringing the coin down to $0.00000064. However, a recurring pattern has emerged within this decline, providing some insight into Pepe’s possible trajectory.
Specifically, after each prominent drop, the coin tends to enter a phase of consolidation, as evident in the 4-hour timeframe. These phases often shape up within two converging trendlines, hinting at the creation of a bearish pennant pattern. Such patterns typically materialize within a dominant downtrend and, when their support line is breached, can result in a continuation of the downward movement.
Given that Pepe coin has exhibited a similar pattern over the last six days, it indicates a potential continuation of its bearish trend.
Is $0.00000055 Next?
The entire consolidation phase in PEPE price has been wobbling within the range of the September 11th candle indicating the candle’s high of $0.00000071 and low of $0.00000064 stands as crucial resistance and support. Thus, with the higher possibility of downturn continuation, the sellers must breach the aforementioned support to accelerate the supply pressure. the post-breakdown fall may push the price to the next psychological support of $0.00000055.
- Relative Strength Index (RSI): Despite the horizontal trend, the upward trajectory of the daily RSI suggests growing buying. momentum aiming to overcome the $0.00000071 resistance.
- Exponential Moving Average (EMA): Over the past month’s downtrend, the PEPE price has struggled to break past the 50-EMA, signifying a strong resistance that has thwarted buyers.
Play 10,000+ Casino Games at BC Game with Ease
- Instant Deposits And Withdrawals
- Crypto Casino And Sports Betting
- Exclusive Bonuses And Rewards


Why Trust CoinGape
CoinGape has covered the cryptocurrency industry since 2017, aiming to provide informative insights Read more…to our readers. Our journal analysts bring years of experience in market analysis and blockchain technology to ensure factual accuracy and balanced reporting. By following our Editorial Policy, our writers verify every source, fact-check each story, rely on reputable sources, and attribute quotes and media correctly. We also follow a rigorous Review Methodology when evaluating exchanges and tools. From emerging blockchain projects and coin launches to industry events and technical developments, we cover all facets of the digital asset space with unwavering commitment to timely, relevant information.

Related Articles


- Indiana Signs Bitcoin Bill Into Law Allowing Crypto in Retirement Plans
- ‘Time to Act Is Now’: CFTC Chief Pushes Swift Passage of CLARITY Act
- Trump Tells Congress to Pass Crypto Market Bill ‘ASAP,’ Blasts Banks for Stalling
- BTC Price Bounces as Spot Investors Buy The Dip Amid Iran War Jitters
- CFTC Chief Mike Selig Signals US Crypto Perpetual Futures Rollout in Coming Weeks
- Gold Price Prediction March 2026: Rally, Crash, or Record Highs?
- RIOT Stock Prediction as Needham, Piper Sandler Slash Target After Earnings
- Cardano Price Outlook As Charles Hoskinson Warns Over CLARITY Act
- Circle Stock Price Climbs 15% to $96, Can Rally Continue in March 2026?
- Bitcoin Price Prediction as US-Iran War Enters 4th Consecutive Day
- Top 5 Historical Reasons Dogecoin Price Is Not Rising


