
$PEPE Price At Risk of 14% Drop If Sellers Break this Key Support


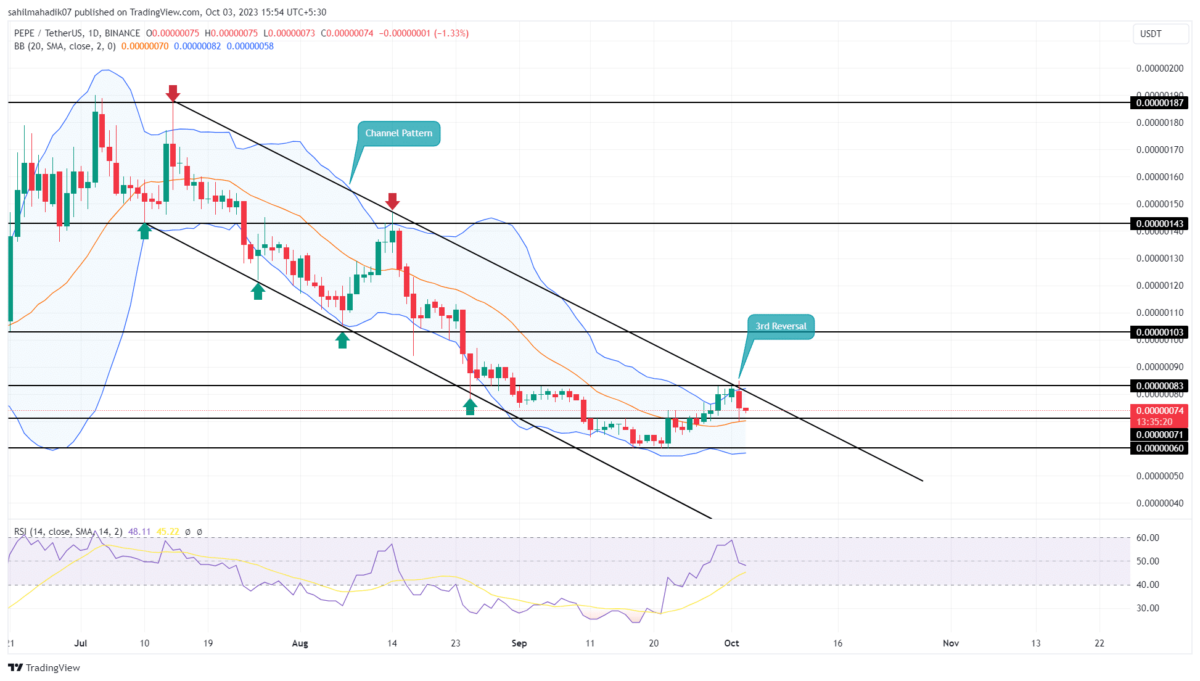
In the final weeks of September, the PEPE price staged an impressive recovery, erasing all earlier losses from the first half of the month. The price surged from $0.0000006 to $0.00000083, marking a substantial 37.5% gain. However, this rally met a significant obstacle at a dual resistance level, consisting of the $0.00000083 price point and the upper trendline of a channel pattern. The question is whether the current bullish sentiment can help buyers overcome this hurdle.
Also Read: Is Pepecoin Worth The Hype
Will the PEPE Price Fall Back to $0.0000006
- The high supply pressure at $0.0000083 pushed the PEPE price lower.
- A falling channel pattern continues to pressure this memecoin for a more prolonged correction trend.
- The 24-hour trading volume in the Pepe coin is $79.2 Million, indicating a 1% loss.
 Source: Tradingview
On October 2nd, the Pepe coin price action showed a strong bearish engulfing candle at the resistance trendline of the channel pattern. This candle, which eclipsed the preceding three days of trading, could be an early warning signal for a potential bearish reversal.
Currently trading at $0.00000074 at the time of this analysis, and experiencing an intraday loss of 1.33%, the asset could be poised for a downward trajectory. A breach below yesterday’s low of $0.000000107 would provide the market with additional confirmation for an impending correction.
This could potentially trigger a 14% slide to retest the last swing low at $0.0000006, and possibly extend the downtrend even further should selling pressure continue to mount.
PEPE vs DOGE vs SHIB Performance
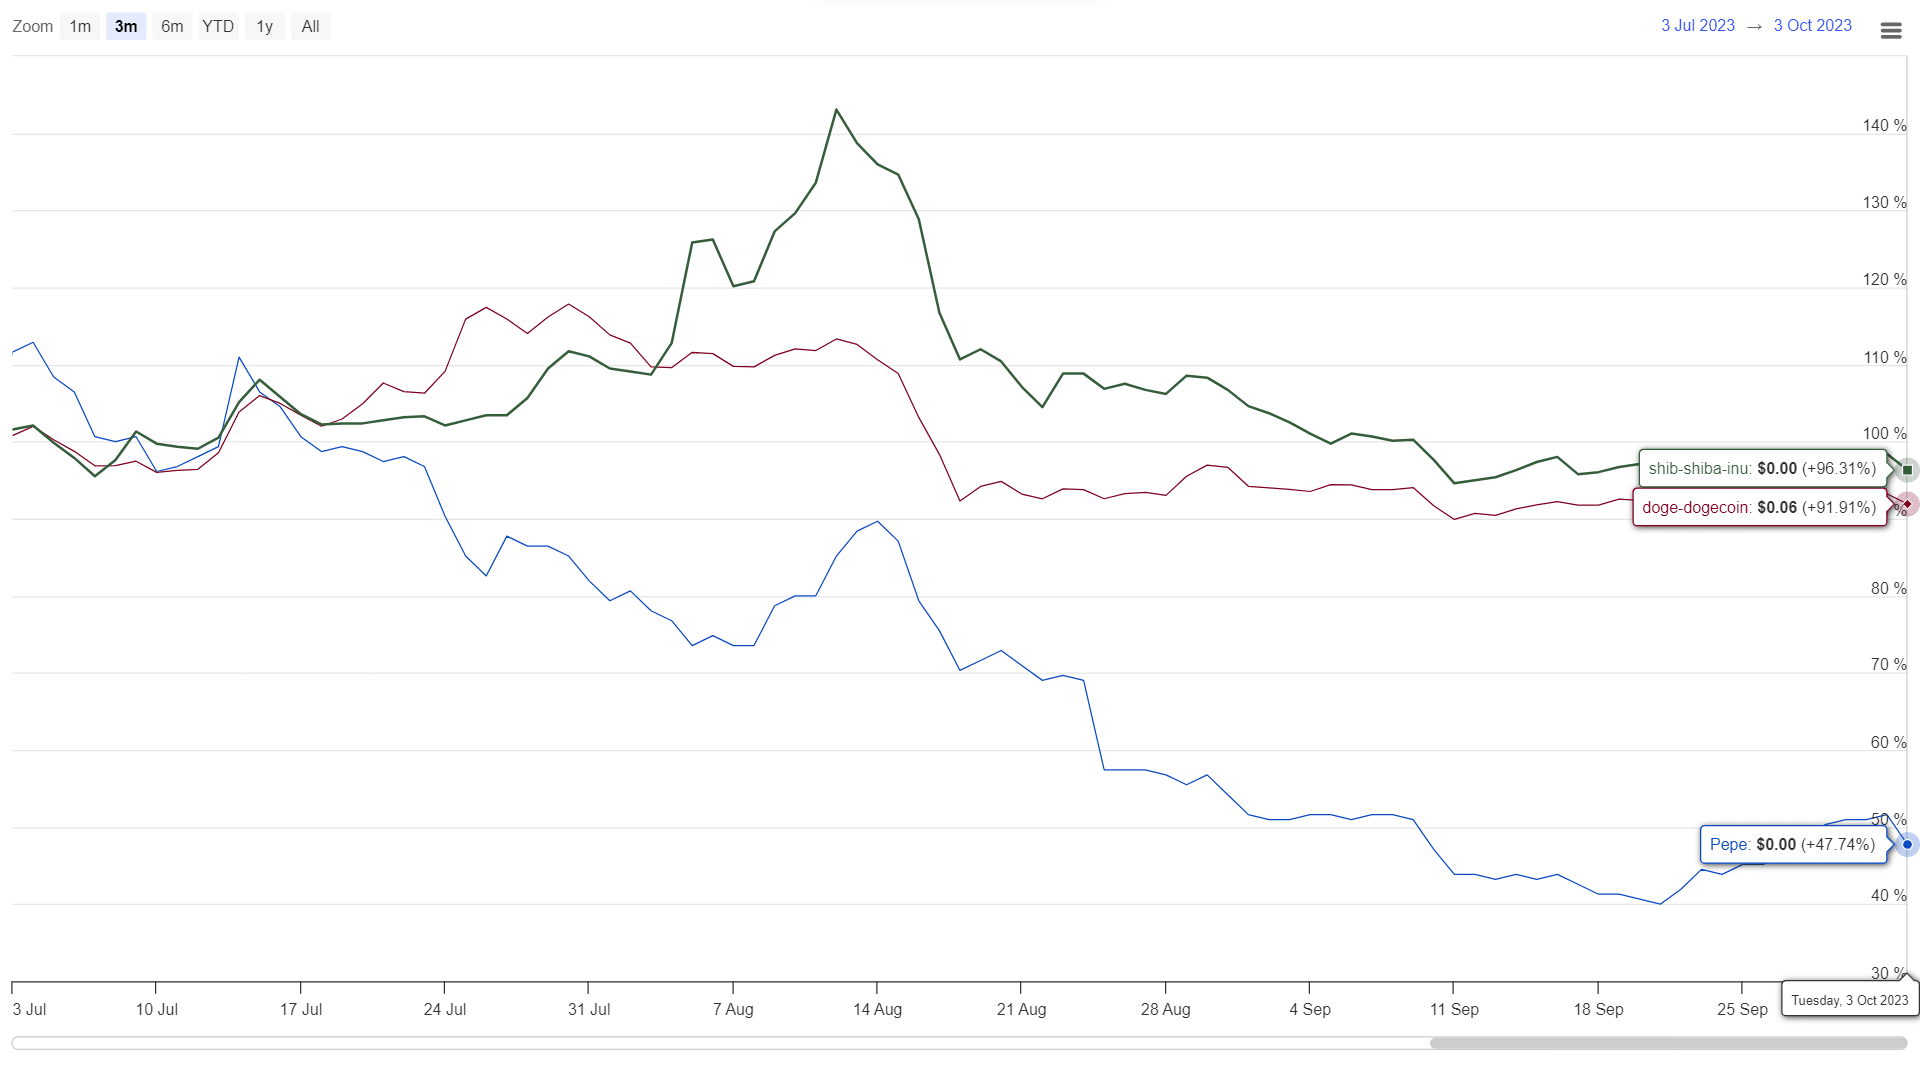 Source: Coingape| Pepe coin Vs Dogecoin Vs Shiba Inu Price
When comparing the price action over the last three months, the Pepe Coin has displayed higher volatility than the Dog-theme meme coins like SHIB and Doge. While Pepe Coin has been in a consistent downtrend, both Shiba Inu price and Dogecoin price have exhibited more sideways movements in their mid-term trends.
- Bollinger Bands: The flattening of the upper Bollinger Band suggests it could act as an additional resistance level, further challenging bullish attempts.
- Relative Strength Index: The daily RSI dipping below the 60% level implies that a managed reversal is increasingly likely, providing another cautionary signal for traders bullish on memecoin.
Play 10,000+ Casino Games at BC Game with Ease
- Instant Deposits And Withdrawals
- Crypto Casino And Sports Betting
- Exclusive Bonuses And Rewards


Why Trust CoinGape
CoinGape has covered the cryptocurrency industry since 2017, aiming to provide informative insights Read more…to our readers. Our journal analysts bring years of experience in market analysis and blockchain technology to ensure factual accuracy and balanced reporting. By following our Editorial Policy, our writers verify every source, fact-check each story, rely on reputable sources, and attribute quotes and media correctly. We also follow a rigorous Review Methodology when evaluating exchanges and tools. From emerging blockchain projects and coin launches to industry events and technical developments, we cover all facets of the digital asset space with unwavering commitment to timely, relevant information.
Pepe
24 Hours volume
$706.63M
Market Cap
$1.69B
Max Supply
420.69T


- TRUMP Coin Whales Reach 5-Month High Ahead Gala Luncheon For Top Token Holders
- CLARITY Act: Crypto Industry and Banks Near Deal as Bill’s Odds Jump Above 60%
- Breaking: Trump Says Iran Wants To Make A Deal With U.S., Bitcoin Rises
- Top 3 factors Why XRP Price is Skyrocketing Today (16th March)
- Ethereum Targets $4K as Peter Brandt Flags Potential ETH Bottom
- MSTR Stock Prediction as Strategy Makes Largest Bitcoin Purchase in 2026 and Analyst Targets BTC Price $100K
- Pi Network Price Prediction After Smart Contract and Second Migration Launch
- Pepe Coin Price Surges 20%- How High Can it Go in March?
- Is XRP Price Gearing Up For $2 Level As BTC Rebounds Above $74k?
- Cardano’s $0.50 Resistance- Can “Midnight” Alpha Defy the Fog of War?
- Bitcoin and XRP Price Outlook If the Senate Banking Committee Approves the CLARITY Act


