 Buy $GGs
PEPE Price Prediction: Breakdown Below Monthly Support Signals 15% Downside Risk


While the bullish sentiment associated with Bitcoin ETF is fading, the crypto market is returning to the prevailing bearish sentiment. A recent price drop in the leading cryptocurrencies Bitcoin and Ethereum has triggered extended correction in several major altcoins. As a result, the Frog theme memecoin PEPE is heading lower which led to a breakdown below monthly support. Is further downfall expected?
Also Read: PEPE Coin Price Analysis: Can $0.0000008 Support Defy the Downward Trend?
Support Breakout Threathens Pepe Coin for Longer Correction
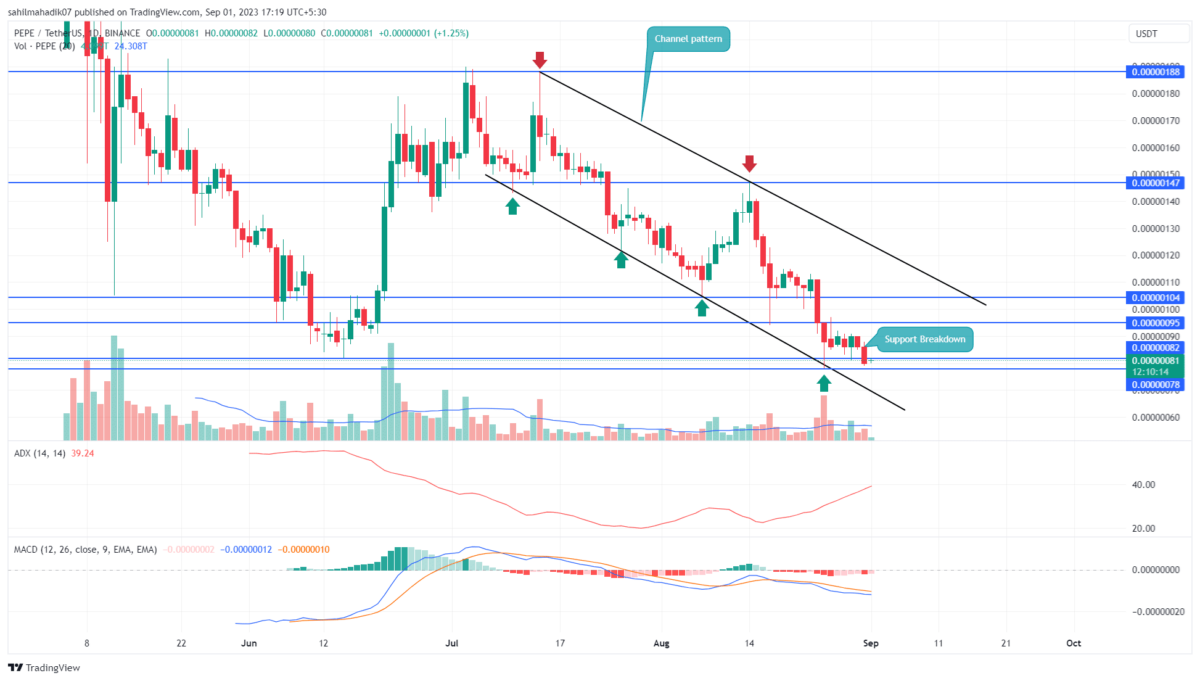
- The Pepe coin is trapped in a sideways trend stretched from $0.00000095 and $0.00000078 horizontal levels.
- A bearish breakdown from $0.00000082 will set the prices for a 15% fall
- The 24-hour trading volume in the Pepe coin is $130 Million, indicating a 92% gain.
 Source- Trading
The Pepe coin price has witnessed aggressive selling pressure in the last two days, registering around 11%. On 30th August, the falling price gave a sharp breakdown below the monthly support of $0.00000082.
This breakout offers sellers additional resistance to pressurize the price for further downfall. As of now, the coin price trades at $0.00000081 with an intraday gain of 1.25%. The minor uptick may retest the breached support as potential resistance and accumulate selling orders.
The post-breakdown fall may likely break the $0.00000078 support and plunge the PEPE price 15% down to hit the psychological level of $0.0000007.
Is PEPE Price Ready for Directional Move?
While the downward projection seems valid for Pepecoin, it should be noted that the last seven days’ price action has traded within the range of the August 25th candle. Therefore this candle’s high of $0.00000095 and low of $0.00000078 stands as strong resistance and support.
If the coin price should demand pressure at the $0.00000078 mark in the coming days, the crypto holders may witness prolonged consolidation.
- Moving Average Convergence Divergence: A bearish crossover state between the MACD(blue) and signal(orange) line reflects the overall trend remains bearish.
- Average Directional Index: The rising ADX slope reflects the aggressive bearish momentum remains intact.
Play 10,000+ Casino Games at BC Game with Ease
- Instant Deposits And Withdrawals
- Crypto Casino And Sports Betting
- Exclusive Bonuses And Rewards


Why Trust CoinGape
CoinGape has covered the cryptocurrency industry since 2017, aiming to provide informative insights Read more…to our readers. Our journal analysts bring years of experience in market analysis and blockchain technology to ensure factual accuracy and balanced reporting. By following our Editorial Policy, our writers verify every source, fact-check each story, rely on reputable sources, and attribute quotes and media correctly. We also follow a rigorous Review Methodology when evaluating exchanges and tools. From emerging blockchain projects and coin launches to industry events and technical developments, we cover all facets of the digital asset space with unwavering commitment to timely, relevant information.

Related Articles


- Breaking: Ethereum Price Drops Amid Israel-Iran Tensions; Machi Big Brother Liquidated Again
- CLARITY Act: Stablecoin Yield Debate Heats Up, but March 1 Deadline Not ‘Do or Die’
- Best Institutional Custody Solutions for Tokenized Assets in 2026
- Minnesota Considers Ban on Bitcoin and Crypto ATMs as Scam Reports Rise
- Breaking: Morgan Stanley Applies For Crypto-Focused National Trust Bank With OCC
- Top Analyst Predicts Pi Network Price Bottom, Flags Key Catalysts
- Will Ethereum Price Hold $1,900 Level After Five Weeks of $563M ETF Selling?
- Top 2 Price Predictions Ethereum and Solana Ahead of March 1 Clarity Act Stablecoin Deadline
- Pi Network Price Prediction Ahead of Protocol Upgrades Deadline on March 1
- XRP Price Outlook As Jane Street Lawsuit Sparks Shift in Morning Sell-Off Trend
- Dogecoin, Cardano, and Chainlink Price Prediction As Crypto Market Rebounds


