 Buy $GGs
PEPE Price Prediction: Double Bottom Pattern Sparks Hope for 40% Rally


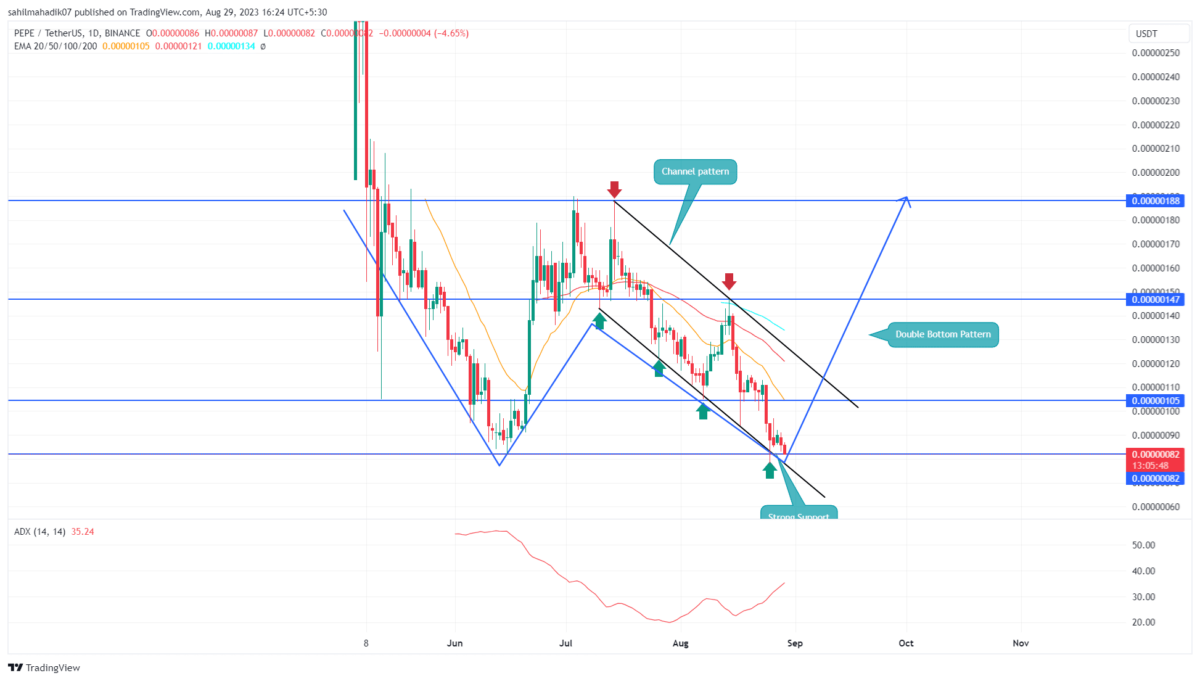
Over the past five days, the Frog-themed memecoin has been hovering above the monthly support of $0.00000082. While the broader market uncertainty prevents the coin buyers from a significant rebound the lower price rejection in the daily candle reflects the rising demand pressure is intact. Here’s how a potential rebound from the aforementioned support could influence the future trend of PEPE price.
Also Read: Pepe Coin Team Gives Clarification Of The 16 Trillion Pepe Tokens Theft
Pepe Coin Daily Chart: Key Points
- A bullish breakout from the upper trendline could offer an early sign of trend reversal
- The PEPE price may witness a high demand pressure at $0.00000082
- The 24-hour trading volume in the Pepe coin is $66.39 Million, indicating a 10% loss.
 Source-tradingview
The Pepe coin price chart shows the ongoing correction is led by a downsloping channel. Along with the above-mentioned $0.00000082 support, the lower trendline of this pattern offers an additional push for a rebound.
In the past weeks, the PEPE price has rebounded from this trendline support multiple times, indicating the buyer’s active accumulation. The potential rebounded could raise the prices 40% higher to hit the upper trendline near $0.00000115.
However, the chart indicates this anticipated as the formation of a bullish reversal pattern called a double bottom. The chart pattern often spotted at the market bottom is a sign of increased accumulation.
Under the influence of this setup, the Pepe coin price may trigger a rally to $0.00000188.
Can the PEPE Price Rise Back to $0.0000015?
While the bullish outlook seems valuable for the PEPE price, the influence of the channel pattern is still aggressive on traders. Therefore, the investors looking for a safer entry should wait for a breakout above the resistance trendline as it may bolster buyers for the early target of $0.0000015.
On a contrary note, a bearish breakdown below the $0.00000082 or channel pattern may invalidate the bullish thesis
- Average Directional Index: The daily ADX at 35% reflects the ongoing correction in reaching maturity, bolstering the potential of a bullish reversal
- Exponential Moving Average: The downsloping EMAs(20, 50, and 100) could offer dynamic resistance in-market buyers.
Play 10,000+ Casino Games at BC Game with Ease
- Instant Deposits And Withdrawals
- Crypto Casino And Sports Betting
- Exclusive Bonuses And Rewards


Why Trust CoinGape
CoinGape has covered the cryptocurrency industry since 2017, aiming to provide informative insights Read more…to our readers. Our journal analysts bring years of experience in market analysis and blockchain technology to ensure factual accuracy and balanced reporting. By following our Editorial Policy, our writers verify every source, fact-check each story, rely on reputable sources, and attribute quotes and media correctly. We also follow a rigorous Review Methodology when evaluating exchanges and tools. From emerging blockchain projects and coin launches to industry events and technical developments, we cover all facets of the digital asset space with unwavering commitment to timely, relevant information.

Related Articles


- Breaking: Morgan Stanley Applies For Crypto-Focused National Trust Bank With OCC
- Ripple Could Gain Access to U.S. Banking System as OCC Expands Trust Bank Services
- $2T Barclays Explores Blockchain For Stablecoin Payments and Tokenized Deposits
- Breaking: U.S. PPI Inflation Rises To 2.9%, BTC Price Falls
- XRP News: Ripple-Backed Ctrl Alt Completes $280M in Diamond Tokenization on XRPL
- Top Analyst Predicts Pi Network Price Bottom, Flags Key Catalysts
- Will Ethereum Price Hold $1,900 Level After Five Weeks of $563M ETF Selling?
- Top 2 Price Predictions Ethereum and Solana Ahead of March 1 Clarity Act Stablecoin Deadline
- Pi Network Price Prediction Ahead of Protocol Upgrades Deadline on March 1
- XRP Price Outlook As Jane Street Lawsuit Sparks Shift in Morning Sell-Off Trend
- Dogecoin, Cardano, and Chainlink Price Prediction As Crypto Market Rebounds


