PEPE Price Prediction: Key Resistance Level to Watch Before Hitting $0.000001

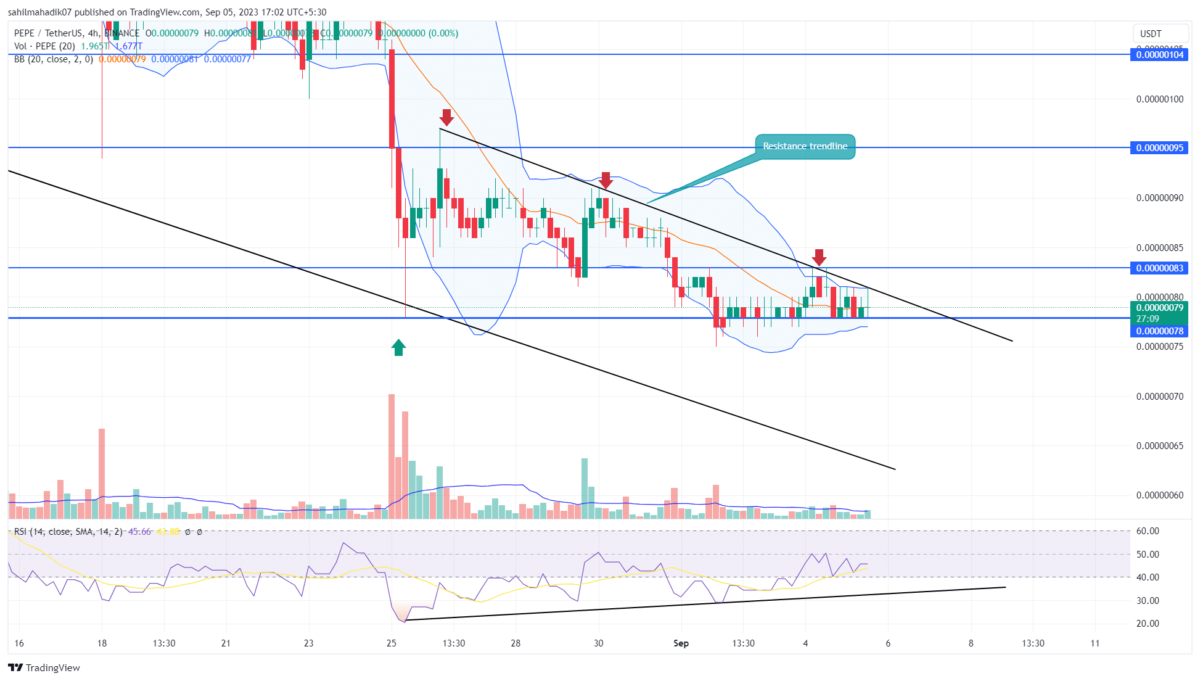
Amid the increasing bearishness in the crypto market, the Pepe coin price has witnessed an aggressive downfall in the last two weeks. The daily time frame chart shows this downfall can be followed by a downsloping resistance trendline offering constant resistance to the falling prices. Will this resistance prolong the ongoing downtrend or flip to support a bullish reversal?
Also Read: PEPE Price Prediction: Rising Demand Pressure Sets Pepe Coin Rally to $0.0000011
Potential Breakout Could Surge the PEPE Price to $0.000001
- Two neutral candles in the daily chart of the Pepe coin experiencing indecisive market sentiment from traders.
- A bullish breakout from the overhead trendline could propel the prices 30% high
- The 24-hour trading volume in the Pepe coin is $39 Million, indicating a 23% gain.

On September 1st, the PEPE price gave a bearish breakdown from the $0.00000078 support level and fell to a new three-month low of $0.00000075. However, the buyers stepped in immediately and pushed the prices back above the breached trendline.
Such fake breakdown scenarios usually accelerate the bullish momentum and offer long entry opportunities to traders. Thus, the memecoin price surged to the $0.00000083 mark but faced overhead supply at the resistance trendline.
By the press time, the Pepe coin trades at $0.00000081 and showcases a sideways trend in the daily time frame chart. Therefore, the potential traders must wait for a breakout of the overhead trendline to gain better confirmation of a bullish recovery.
Here’s What Pepecoin Needs to Boost a Sustained Rally
A bullish breakout from the resistance trendline would likely surge the memecoin 30% higher to hit the $0.00000104 mark. While this anticipated upswing should assist in restoring a recovery sentiment in the market, the aforementioned level aligned with the upper boundary of the channel pattern stands as a high support zone. Therefore, a breakout above this barrier is needed to trigger sustained recovery.
- Relative Strength Index: Contrary to the flailing price, the 4-hour chart RSI slope shows an evident rally indicating the rising bullish momentum at the bottom.
- Bollinger Band: The narrow Bollinger band indicator reflects uncertainty among market traders, but also an opportunity for a decisive breakout.
- Bitcoin Crashes to $72k as U.S.–Iran Tensions Rise After Talks Collapse
- Bringing Compute Power to the Masses in a Sustainable, Decentralized Manner
- Bitcoin Reserve: U.S. Treasury Rules Out BTC Buys as GOP Senators Push For Use Of Gold Reserves
- Epstein Files: How Jeffrey Epstein Had Ties to Bitcoin and Crypto’s Early Development
- Crypto Market Continues to Plunge, Could 2026 Be the Worst Year?
- Dogecoin Price Prediction After SpaceX Dogecoin-Funded Mission Launch in 2027
- Solana Price Crashes Below $95 for the First Time Since 2024: How Low Will SOL Go Next?
- Ethereum Price Eyes a Rebound to $3,000 as Vitalik Buterin Issues a Warning on Layer-2s
- Pi Network Price Outlook as Bitcoin Faces a Strong Sell-Off Below $80k
- Bitcoin Price Prediction As US House Passes Government Funding Bill to End Shutdown
- Ondo Price Prediction as MetaMask Integrates 200+ Tokenized U.S. Stocks


