 Buy Presale
PEPE Price Prediction: Rising Demand Pressure Sets Pepe Coin Rally to $0.0000011


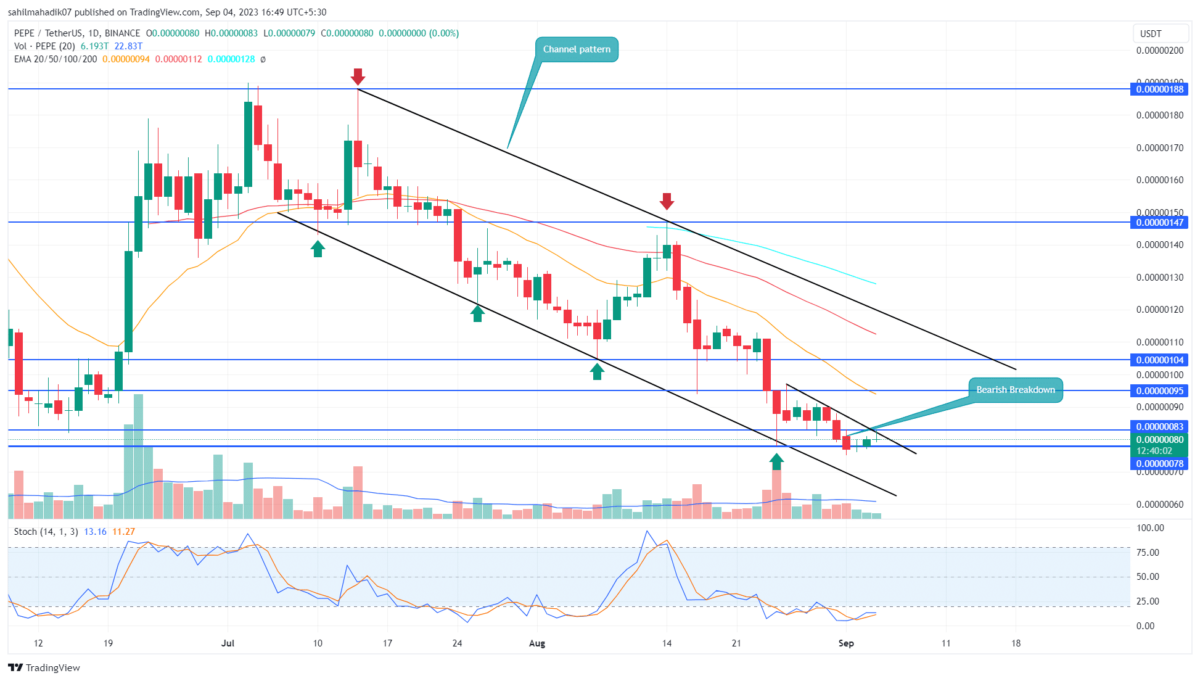
On September 1st, the Pepe coin price gave a decisive breakdown from the August 25th low of $0.00000078 as a signal of downtrend continuation. However, the sellers could not provide a suitable follow-up reflecting their lack of conviction. Thus, the popular memecoin surged back above the aforementioned support, indicating the prior fall was a bear trap that could increase market buying in the market.
Also Read: PEPE Price Prediction: Will Pepe Coin Reclaim $0.000001 in September?
Trendline Breakout Could Push the PEPE Price to $0.0000011
- A bullish breakout from $0.00000083 could set the PEPE price at 35%
- The memecoin trades may fave supply pressure at the channel pattern’s resistance
- The 24-hour trading volume in the Pepe coin is $51 Million, indicating a 35% gain.
 Source- Trading
After the September 1st fake breakdown from the $0.00000078 support, the daily chart showed an immediate bullish reversal with the formation of the Morning Star candle. This minor recovery could be associated with the most prominent cryptocurrency Bitcoin witnessing demand pressure at $25000.
Thus, the PEPE price surged 5% in the last three days and is currently trading at $0.00000082. This reversal could trigger a short-term relief rally to $0.00000011 registering a potential gain of 34%.
However, the coin price faces dual resistance from the September 1st high of $0.00000083 and a downsloping resistance trendline. An upside breakout from these barriers will give a better confirmation for a bullish upswing.
PEPE Coin Needs This Before a Sustained Rally
While the bullish upswing for Pepe coin seems valid and can make a recovery back to the $0.0000011 mark, the daily chart shows the presence of the channel pattern’s resistance. This chart setup has carried a recovery rally for the past two months offering constant resistance during bullish. Therefore, the coin holders must keep a close eye on this barrier for the possibility of a potential reversal.
- Stochastic: The daily stochastic line, K%, and D% wavering around the oversold region could attract more buyers to buy at discounted prices.
- Exponential Moving Average: The coin price trading far below the 20-day EMA slope reflects an aggressive downtrend still in action
Play 10,000+ Casino Games at BC Game with Ease
- Instant Deposits And Withdrawals
- Crypto Casino And Sports Betting
- Exclusive Bonuses And Rewards


Why Trust CoinGape
CoinGape has covered the cryptocurrency industry since 2017, aiming to provide informative insights Read more…to our readers. Our journal analysts bring years of experience in market analysis and blockchain technology to ensure factual accuracy and balanced reporting. By following our Editorial Policy, our writers verify every source, fact-check each story, rely on reputable sources, and attribute quotes and media correctly. We also follow a rigorous Review Methodology when evaluating exchanges and tools. From emerging blockchain projects and coin launches to industry events and technical developments, we cover all facets of the digital asset space with unwavering commitment to timely, relevant information.

Related Articles


- Ripple Bets On AI Boom With Strategic Investment In AI Agent Infrastructure Startup
- Prediction Market News: Kalshi Fines MrBeast Associate Over Insider Trading Amid State Crackdown
- CLARITY Act: Banks, Crypto Yet To Agree On New Crypto Bill Draft As March 1 Deadline Looms
- Michael Saylor Predicts $50T From Bonds Could Flow Into Bitcoin Ecosystem as Digital Credit Evolves
- Bitcoin Treasury Firm GD Culture Authorizes Sale of 7,500 BTC as Expert Warns Of More ‘Pain’
- Dogecoin, Cardano, and Chainlink Price Prediction As Crypto Market Rebounds
- Will Solana Price Rally to $100 If Bitcoin Reclaims $72K?
- XRP Price Eye $2 Rebound as On-Chain Data Signals Massive Whale Accumulation
- Ethereum Price Reclaims $2K- New Rally Ahead or a Temporary Bounce?
- COIN Stock Price Prediction as Wall Street Pros Forecast a 62% Surge
- Cardano Price Signals Rebound as Whales Accumulate 819M ADA


