 Buy $GGs
PEPE Price Prediction: Will Market Reversal Push Pepe Coin Recovery Above $0.0000008?


During the second week of September, the crypto market saw a notable sell-off. The Pepe coin wasn’t spared, breaking below the psychological support of $0.0000007 with considerable volume. This move seemed to highlight the sellers’ determination to push the price down. Yet, with Bitcoin rallying from the $25,000 benchmark, there’s been a shift in market sentiment, causing the Pepe price descent to plateau and casting doubts on its future trajectory.
Also Read: What’s Next For Pepe Coin After Losing $0.0000007 Support?
Failed Breakdown of $0.0000007 may Bolster PEPE Price to Regain Lost Ground
- Bear trap set could increase the demand pressure in the SHIB price
- A bearish reversal from $0.0000007 could push the prices 46% higher
- The 24-hour trading volume in the Pepe coin is 44.9 $ Million, indicating a 2.11% loss.
 Source- Trading
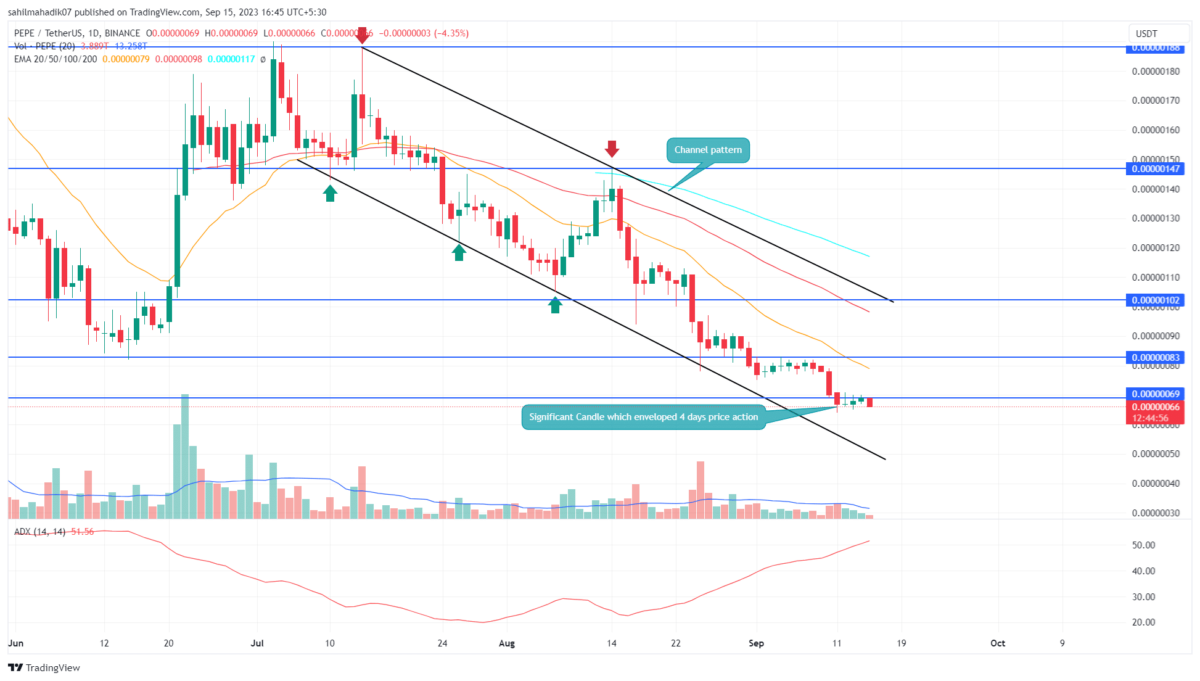
The past four days of Pepe coin price movement are tightly contained within the price range established on September 11th. This day’s candle high at $0.00000071 acts as a significant resistance, while its low at $0.00000064 serves as formidable support.
The lack of a bearish follow-through after breaking the $0.0000007 mark hints at dwindling bearish momentum. Given the overall market’s budding recovery signs, it’s plausible for memecoin enthusiasts to drive Pepe coin above the mentioned level, framing the recent breakdown as a mere bear trap.
Should this breakout materialize, it’s likely to further boost buying momentum, pushing prices well beyond the $0.00000085 threshold.
Chart Pattern Reflect Threat for further correction

On the 4-hour time frame chart, the current price consolidation forms what looks like a bearish pennant — a pattern typically seen during ongoing downtrends and defined by converging trend lines. If Pepe coin’s price breaches the pennant’s lower boundary, it would signal that sellers have regained control, potentially driving prices down to as low as $0.0055.
- Exponential Moving Average: The downsloping 20-day EMA reflects high selling momentum in active
- Average Directional Index: The daily ADX slope at 47% indicates the ongoing downward trend could exhaust soon to offer buyers an opportunity to reclaim trend control
Play 10,000+ Casino Games at BC Game with Ease
- Instant Deposits And Withdrawals
- Crypto Casino And Sports Betting
- Exclusive Bonuses And Rewards


Why Trust CoinGape
CoinGape has covered the cryptocurrency industry since 2017, aiming to provide informative insights Read more…to our readers. Our journal analysts bring years of experience in market analysis and blockchain technology to ensure factual accuracy and balanced reporting. By following our Editorial Policy, our writers verify every source, fact-check each story, rely on reputable sources, and attribute quotes and media correctly. We also follow a rigorous Review Methodology when evaluating exchanges and tools. From emerging blockchain projects and coin launches to industry events and technical developments, we cover all facets of the digital asset space with unwavering commitment to timely, relevant information.

Related Articles


- Peter Brandt Flips Bullish, Predicts Bitcoin Rally As Price Holds Above $70k
- XRP News: Institutional Use Case Expands as Doppler Finance Integrates WXRP for Multi-Chain Access
- Trump Tariffs: Bitcoin Faces Fresh Headwinds as 15% Global Tariffs Begin This Week Amid Iran War
- Bitget Unveils ‘Crypto Anti-Bias Pledge’ To Support Women’s Inclusion In Crypto
- U.S.-Iran War: Crypto Market Rebounds as Iran Reportedly Reaches Out To U.S. To End Conflict
- Dogecoin Price Outlook as BTC Recovers Above $73,000
- XRP Price Prediction as Iran-U.S. Peace Talks Trigger a Crypto Rally
- COIN Stock Analysis as Bitcoin Retests $72k Ahead of February NFP Data
- Robinhood Stock Price Prediction As Cathie Wood Buys $12M Dip in Bold ARK Move
- Bitcoin Price At Risk? Professor Who Predicted US-Iran War Says America Could Lose
- Gold Price Prediction March 2026: Rally, Crash, or Record Highs?


