Pepecoin Price Analysis: How Far Will the Retracement Take $PEPE Price?


Pepepcoin Price Analysis: While the market leaders, Bitcoin and Ethereum price showed a halt in their recovery rally, the Frog-themed Memecoin Pepe entered a minor correction phase after hitting the $0.0000019 barrier. This retracement seems reasonable as the buyers would need a break after significant growth in the latter part of June. However, will PEPE price continue to uptrend after this correction?
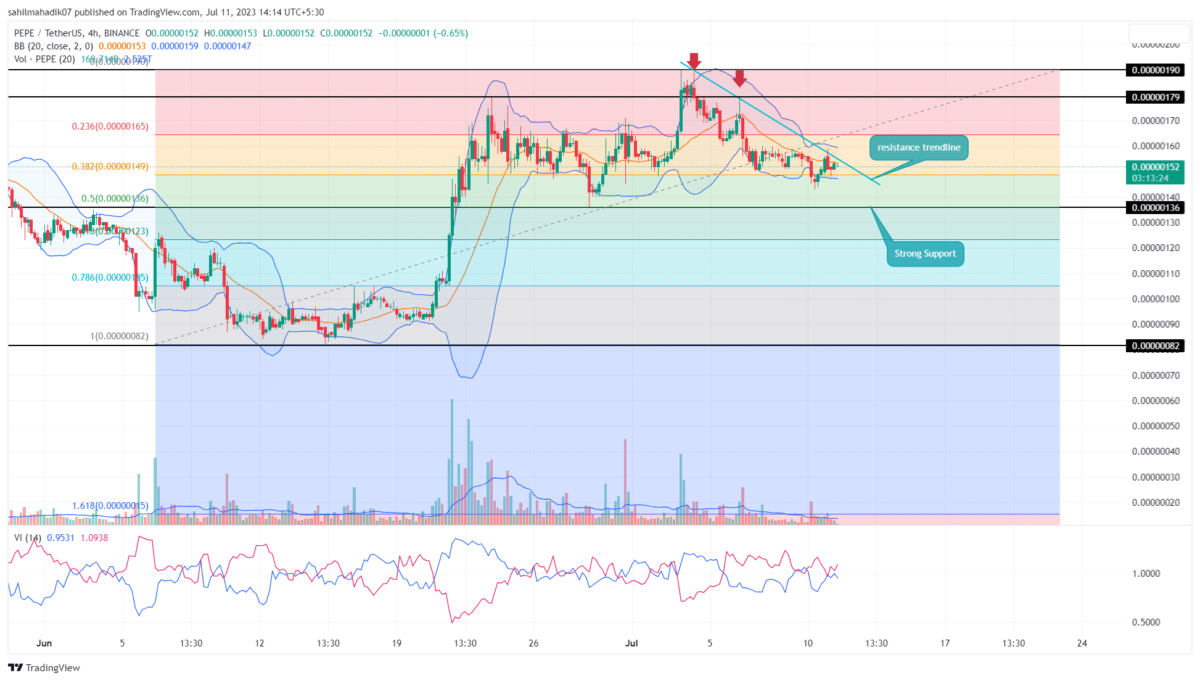
Pepecoin Price Daily Chart
- The $0.00000136 support stands as a crucial support of the PEPE price.
- A breakout above the overhead trendline will reignite the bullish momentum.
- The 24-hour trading volume in the Pepecoin coin is $114.5 Million, indicating a 56 % gain.
 Source-Tradingview
Over the week, the PEPE price has tumbled around 24.6% from $0.0000019 and reached today’s low of $0.00000143. This correction phase is currently carried by a downsloping trendline acting as a dynamic resistance to pressurize buyers.
By press time, this memecoin trades at $0.0000015 and shows long-tail rejection at 38.2% Fibonacci retracement level. Thus, demand pressure could trigger another bounce to the overhead trendline and replenish the selling momentum.
With sustained buying, the PEPE price could tumble another 8% and retest the strong demand zone of $0.00000136 in confluence with 50% FIB. This level is crucial for buyers as losing the last swing low would indicate notable weakness in bullish momentum.
Will Pepecoin Coin Strike the 0.0000019 Barrier?
The falling Pepecoin price backed by reducing volume indicates the current correction is temporary. Therefore, interested traders looking for a long entry opportunity must wait for a breakout above the overhead trendline. This breakout will signal the resumption of a bullish recovery and the possibility to surpass the $0.0000019 mark.
- Bollinger Band: The lower band of the Bollinger Band indicator at $0.0000019 increases the support power of this level.
- Vortex indicator: A bearish crossover between the VI+(Blue) and VI-(orange) reflects the increasing selling momentum in price.

Why Trust CoinGape
CoinGape has covered the cryptocurrency industry since 2017, aiming to provide informative insights Read more…to our readers. Our journal analysts bring years of experience in market analysis and blockchain technology to ensure factual accuracy and balanced reporting. By following our Editorial Policy, our writers verify every source, fact-check each story, rely on reputable sources, and attribute quotes and media correctly. We also follow a rigorous Review Methodology when evaluating exchanges and tools. From emerging blockchain projects and coin launches to industry events and technical developments, we cover all facets of the digital asset space with unwavering commitment to timely, relevant information.

Related Articles


- Expert Warns Bitcoin Bear Market Just In ‘Phase 1’ as Glassnode Flags BTC Demand Exhaustion
- SEC Chair Reveals Regulatory Roadmap for Crypto Securities Amid Wait for CLARITY Act
- ProShares Launches First GENIUS Act Focused Money Market ETF, Targeting Ripple, Tether, Circle
- BTC Price Falls as Initial Jobless Claims Come In Below Expectations
- Breaking: CME Group To Launch 24/7 BTC, ETH, XRP, SOL Futures Trading On May 29
- Top 3 Price Predictions Feb 2026 for Solana, Bitcoin, Pi Network as Odds of Trump Attacking Iran Rise
- Cardano Price Prediction Feb 2026 as Coinbase Accepts ADA as Loan Collateral
- Ripple Prediction: Will Arizona XRP Reserve Boost Price?
- Dogecoin Price Eyes Recovery Above $0.15 as Coinbase Expands Crypto-Backed Loans
- BMNR Stock Outlook: BitMine Price Eyes Rebound Amid ARK Invest, BlackRock, Morgan Stanley Buying
- Why Shiba Inu Price Is Not Rising?


