Pepecoin Price Analysis: What’s Next for $PEPE Price after 15% Jump Today?


Pepepcoin Price Analysis: Pepecoin, the frog-themed cryptocurrency, recently underwent a correction phase following a price rally that hit the $0.00000178 barrier in late June. This retracement lasted for over a week, allowing the exhausted bullish momentum to recuperate. Thus, with today’s price surge, the PEPE price reflected the continuation of the prevailing uptrend.
Also Read: Pepecoin Price Analysis: Will $PEPE Price Surpass $0.000002 in July?
Pepecoin Price Daily Chart
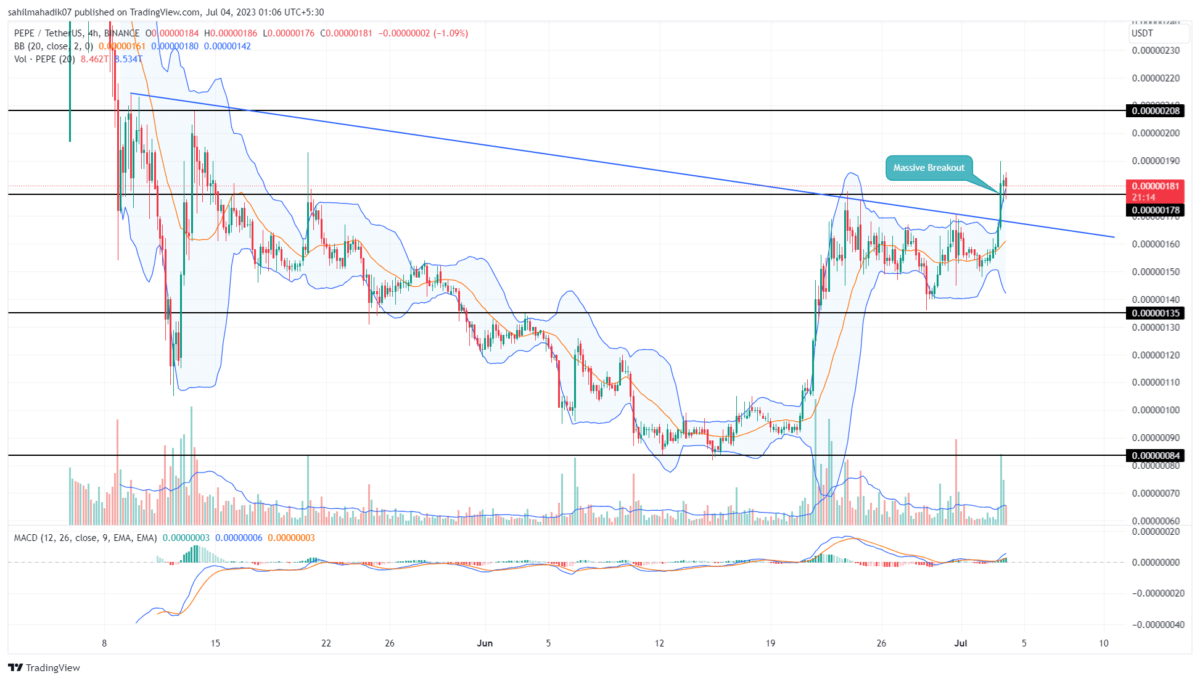
- A breakout above the downsloping trendline and $0.0000178 resistance set the PEPE price for a 15% extended recovery
- The coin buyers can maintain a bullish outlook if the prices show sustainability above the breached trendline
- The 24-hour trading volume in the Pepecoin coin is $348.8 Million, indicating a 265 % gain.
 Source-Tradingview
Today, Pepecoin witnessed a significant inflow of buying pressure, leading to an impressive 15% intraday jump. This surge enabled the memecoin to breach two crucial resistance levels: a downsloping trendline and the previously mentioned $0.00000178 barrier. A high momentum breakout signifies a potential shift in the market sentiment and sets the stage for further bullish momentum.
This bullish breakout backed by a surge in volume action indicates heightened market interest and suggests the rally may have substantial momentum behind it.
By the press time, the Pepecoin trades at $0.0000018, and if the price sustained above $0.00000178, the buyers could drive a rally of another 15% to hit the next significant resistance of $0.00000208.
Will Pepecoin Coin Hit $0.000002 mark?
In the 4-hour time frame chart, the Pepecoin price shows two candlesticks projecting a lower price rejection tail at recently breached $0.00000178. This rejection indicates the buyers obtaining significant support from the new support, which can be used to climb higher chart levels. With sustained buying, the coin price could surge to the $0.00000208 barrier, followed by $0.0000024.
- Bollinger Band: The higher band of the Bollinger Band indicator stretched on the upper side reflects the increased bullish momentum.
- Moving Average Convergence Divergence: A bullish alignment where the MACD slope(blue) moves above the signal line(orange) indicates the over-market trend is positive.

Why Trust CoinGape
CoinGape has covered the cryptocurrency industry since 2017, aiming to provide informative insights Read more…to our readers. Our journal analysts bring years of experience in market analysis and blockchain technology to ensure factual accuracy and balanced reporting. By following our Editorial Policy, our writers verify every source, fact-check each story, rely on reputable sources, and attribute quotes and media correctly. We also follow a rigorous Review Methodology when evaluating exchanges and tools. From emerging blockchain projects and coin launches to industry events and technical developments, we cover all facets of the digital asset space with unwavering commitment to timely, relevant information.

Related Articles


- Crypto Market Rises as U.S. and Iran Reach Key Agreement On Nuclear Talks
- Trump Tariffs: U.S. Raises Global Tariff Rate To 15% Following Supreme Court Ruling
- Bitwise CIO Names BTC, ETH, SOL, and LINK as ‘Mount Rushmore’ of Crypto Amid Market Weakness
- Prediction Market News: Kalshi Faces New Lawsuit Amid State Regulatory Crackdown
- Will Bitcoin Crash To $58k or Rally to $75k After Hot PCE Inflation Data?
- Dogecoin Price Prediction Feb 2026: Will DOGE Break $0.20 This month?
- XRP Price Prediction As SBI Introduces Tokenized Bonds With Crypto Rewards
- Ethereum Price Rises After SCOTUS Ruling: Here’s Why a Drop to $1,500 is Possible
- Will Pi Network Price See a Surge After the Mainnet Launch Anniversary?
- Bitcoin and XRP Price Prediction As White House Sets March 1st Deadline to Advance Clarity Act
- Top 3 Price Predictions Feb 2026 for Solana, Bitcoin, Pi Network as Odds of Trump Attacking Iran Rise


