
Pepecoin Price Analysis: Will the Falling PEPE Price Lose $0.00000084 Support?


Pepepcoin Price Analysis: Similar to the majority of major cryptocurrencies, the PEPE price prolongs its correction trend amid the increased selling pressure in the crypto market. The downtrend continuation formed new lower lows and lower highs indicating an established downtrend. The falling price recently breached another local support of $0.00000096, suggesting that this memecoin is poised for further downfall.
Also Read: Pepe Craze Enters NFT; Bitcoin Frogs Takes Top Spot
Pepecoin Price Daily Chart
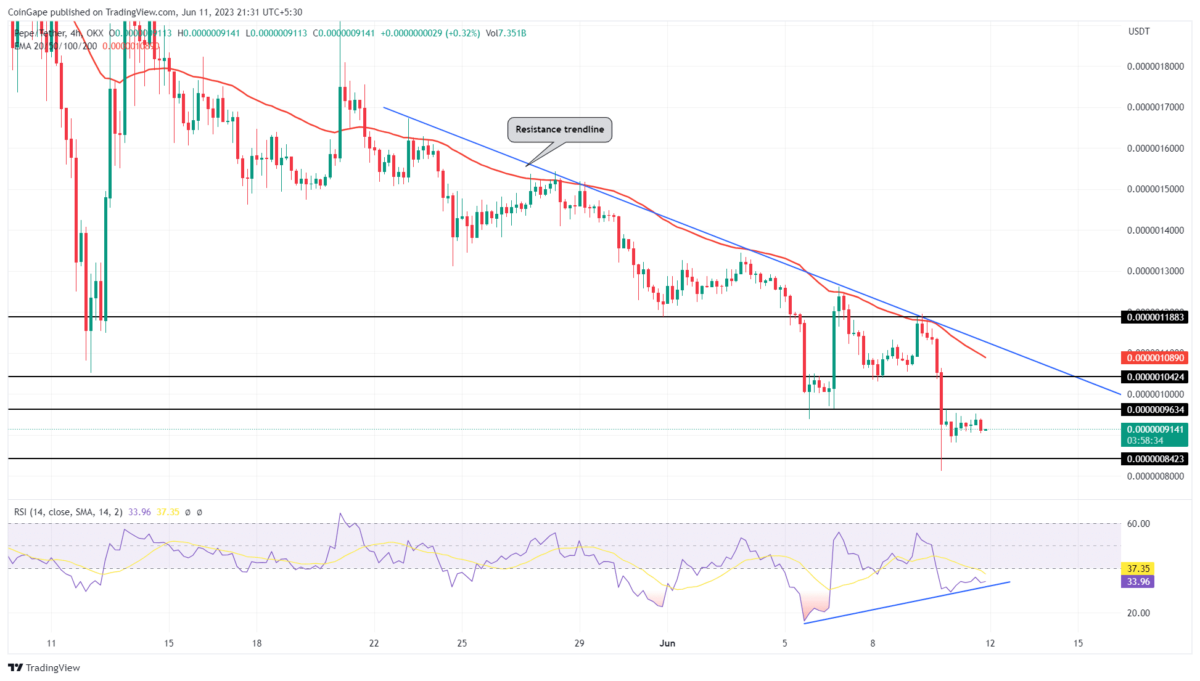
- The downsloping trendline governs the current downfall in PEPE price
- The $0.000000842 stands as a strong accumulation zone
- The 24-hour trading volume in the Pepecoin coin is $126.5 Million, indicating a 43.5 % loss.
 Source-Tradingview
With the June 10th sell-off, the PEPE price gave a decisive breakdown below the $0.000000963 support. By the press time, this memecoin trades at $0.0000009138 and continues to waver below the breached support trying to obtain suitable resistance.
The breakdown set the prices for a potential downfall of 9% and hit the $0.000000842 multi-month support. On June 10th, the PEPE price showed a long-wick rejection at the $0.000000842 support indicating buyers are actively accumulating at this support.
If the coin manages to sustain above the aforementioned support, a potential reversal will assist buyers to challenge the overhead trend, this downsloping resistance has been carrying a steady downfall in PEPE Price over the past three weeks.
Until this trendline is intact, the PEPE may whiteness an aggressive downfall.
Will Pepecoin Coin Sustain Above the 0.000001 Mark?
Over the last three weeks, the PEPE price witnessed multiple reversals from the downsloping trendline. Thus, the potential buyers waiting for an entry opportunity should wait for a breakout above the overhead trendline. Thus, this will signal an early sign of trend reversal and could push the PEPE price back to $0.0000016.
Play 10,000+ Casino Games at BC Game with Ease
- Instant Deposits And Withdrawals
- Crypto Casino And Sports Betting
- Exclusive Bonuses And Rewards


Why Trust CoinGape
CoinGape has covered the cryptocurrency industry since 2017, aiming to provide informative insights Read more…to our readers. Our journal analysts bring years of experience in market analysis and blockchain technology to ensure factual accuracy and balanced reporting. By following our Editorial Policy, our writers verify every source, fact-check each story, rely on reputable sources, and attribute quotes and media correctly. We also follow a rigorous Review Methodology when evaluating exchanges and tools. From emerging blockchain projects and coin launches to industry events and technical developments, we cover all facets of the digital asset space with unwavering commitment to timely, relevant information.


- Breaking: U.S. Prepares for Potential Peace Talks in Iran War as Trump Mulls ‘Winding Down’ Military Efforts
- Crypto Market Recovers as Expert Warns U.S. Easing of Iran Sanctions Won’t Stabilize Oil Prices
- CLARITY Act May Still Delay Despite Stablecoin Yield Deal, Galaxy’s Alex Thorn Warns
- MSTR, COIN, HOOD Stock Prices Crash As FED Rate Hike Odds Climb to 50% in 2026
- US Congress Schedules Tokenization Hearing Next Week as CLARITY Act Advances
- Ethereum, XRP, and Solana Price Prediction As CLARITY Act Advances After Senate–White House Deal
- Why is Pi Network Price Up Today (March 21) Despite Market Wide Correction?
- Bittensor (TAO) Price Surges 20% After Nvidia CEO Comments
- Dogecoin, Shiba Inu, and Pepe Coin Price Prediction If BTC Holds $70k Level
- Cardano (ADA) Price Prediction Amid SEC/CFTC Policy Shift and ETF Update
- Crypto Stock to Watch As Bitcoin Price Crashed Below $70k; CRCL, COIN, MSTR, HOOD


