 Buy $GGs
Polkadot Price Consolidates Below $8.0; What’s Next?


Polkadot price exhibits sideways movement with a negative bias. However, it can not be termed as a downside move as the price is continuously rising after testing the lows of $6.75. The bulls face a strong upside barricade near $8.0, a strong buying momentum is required to push above the mentioned level.
As of press time, DOT/USD is reading at $7.64, down 0.83% for the day. The 24-hour trading volume jumped 86% to $485,033,806 according to CoinMarketCap data.
- Polkadot price extends consolidation for the second day.
- A bullish harmonic pattern suggests the buying could continue flowing through the consolidation.
- The sellers are active near $8.0, a crucial level to trade.
Polkadot price trades near the crucial juncture
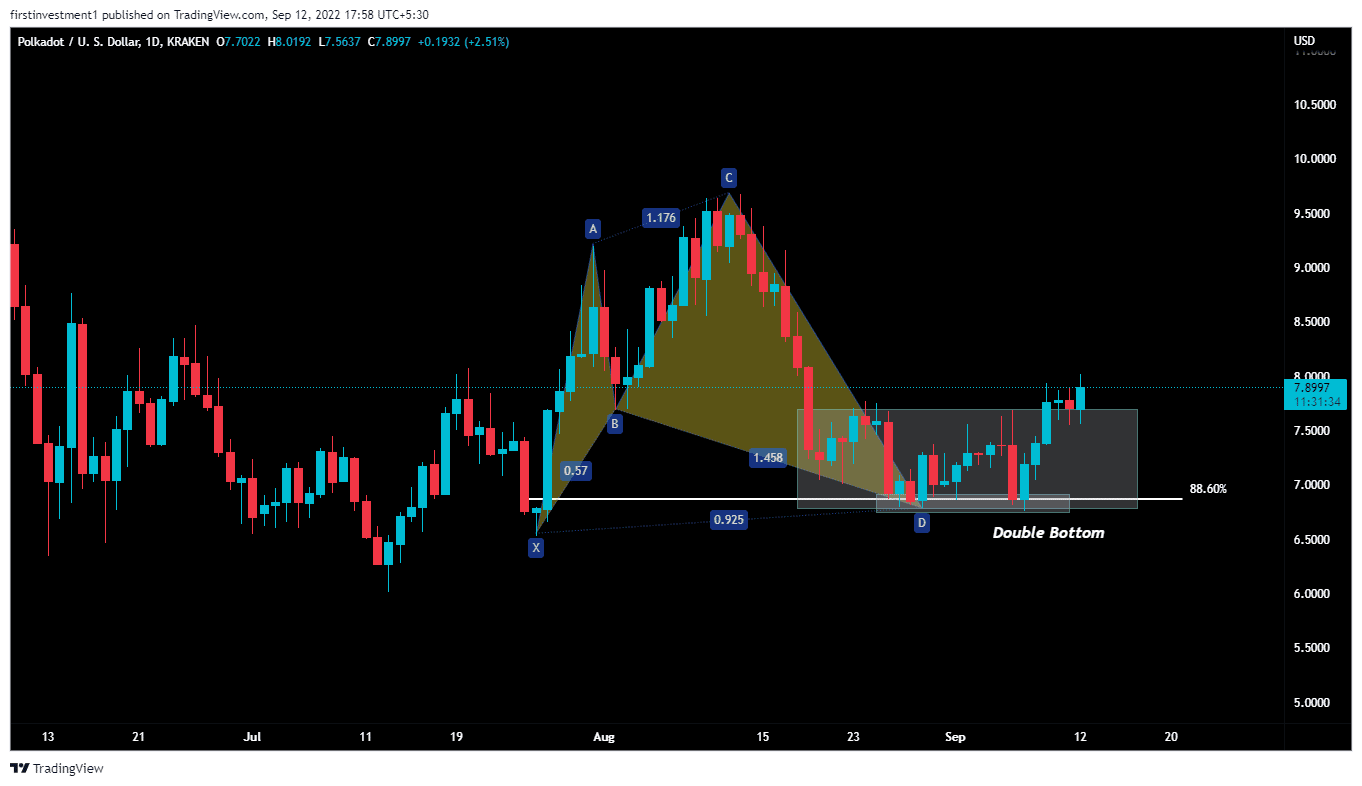
Since the swing low, the Polkadot price has increased 18% and seems to be accomplishing its preceding swing high ($9.69). However, it remains a challenge for the bulls to meet this critical level.
The price formed a bullish “Cypher harmonic” pattern on the daily chart. The technical pattern is a bullish pattern, which is shaped via the 2 tops (A and C) and three bottoms (X, B, and D). Moreover, all the Fibonacci ratios match the pattern’s requirements, and indeed, the D point serves as a bullish reversal point.
After a sharp fall, which occurred between August 13 to August 28, the price entered a consolidation zone forming a “Double Bottom” structure. The token recently gave a breakout of its resistance neckline near the higher levels.
The Polkadot buyers would face minor resistance hurdles, before reaching the ultimate target, as suggested above. This development could see the price t0 revisit the $8.21 and $8.56 mark, respectively. This recent breakout could potentially form a local bottom for DOT at around $6.76 and trigger the start of an uptrend.
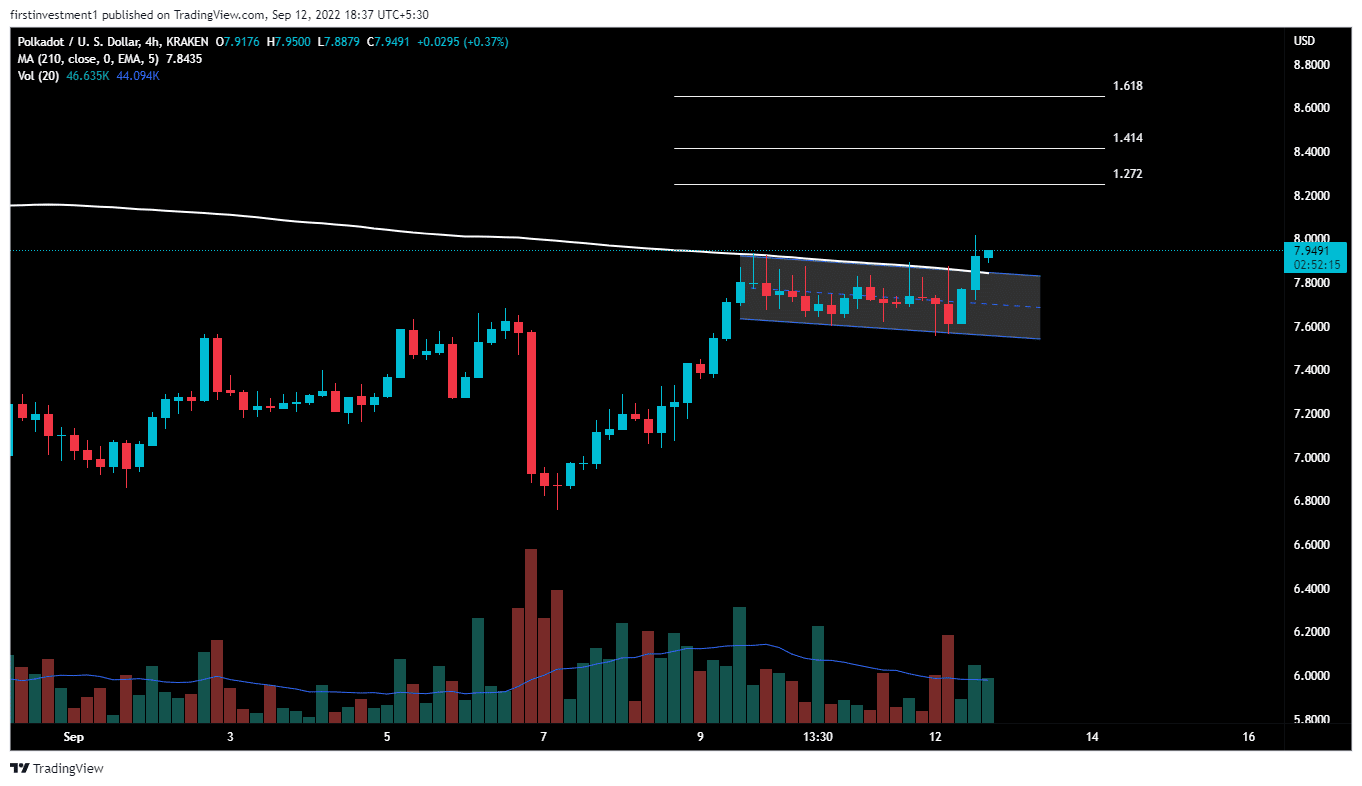
On the four-hour chart, Polkadot gave a bullish breakout of the “Flag & pole” pattern, with good volumes. In addition, the price breached the 200-day exponential moving. According to this pattern, traders should put their stop loss below $7.56, with a target of 1.618 Fibonacci extensions ($8.65).
Also read: https://Mike Novogratz: ‘Monumental’ Thing Working For Crypto In Current Cycle
However, any fall from here could not be considered a dip to buy. DOT gave multiple breakouts after a long consolidation. Any decline will alert the seller to initiate more selling pressure.
Play 10,000+ Casino Games at BC Game with Ease
- Instant Deposits And Withdrawals
- Crypto Casino And Sports Betting
- Exclusive Bonuses And Rewards


Why Trust CoinGape
CoinGape has covered the cryptocurrency industry since 2017, aiming to provide informative insights Read more…to our readers. Our journal analysts bring years of experience in market analysis and blockchain technology to ensure factual accuracy and balanced reporting. By following our Editorial Policy, our writers verify every source, fact-check each story, rely on reputable sources, and attribute quotes and media correctly. We also follow a rigorous Review Methodology when evaluating exchanges and tools. From emerging blockchain projects and coin launches to industry events and technical developments, we cover all facets of the digital asset space with unwavering commitment to timely, relevant information.

Related Articles


- Goldman Sachs CEO Predicts ‘Weeks’ of Crypto Market Crash as U.S Iran War Continues
- Polymarket Axes ‘Nuclear Detonation’ Prediction Market Amid Public Fury
- Indiana Signs Bitcoin Bill Into Law Allowing Crypto in Retirement Plans
- ‘Time to Act Is Now’: CFTC Chief Pushes Swift Passage of CLARITY Act
- Trump Tells Congress to Pass Crypto Market Bill ‘ASAP,’ Blasts Banks for Stalling
- Bitcoin Price At Risk? Professor Who Predicted US-Iran War Says America Could Lose
- Gold Price Prediction March 2026: Rally, Crash, or Record Highs?
- RIOT Stock Prediction as Needham, Piper Sandler Slash Target After Earnings
- Cardano Price Outlook As Charles Hoskinson Warns Over CLARITY Act
- Circle Stock Price Climbs 15% to $96, Can Rally Continue in March 2026?
- Bitcoin Price Prediction as US-Iran War Enters 4th Consecutive Day


