 Buy $GGs
Polygon (MATIC) Aims For $0.85 Following This Bullish Formation


Polygon (MATIC) price analysis turns positive today. The price opened lower but managed to trade in green over the past few hours. The price finds reliable support at around $0.75, resulting in intraday gains.
It is interesting to watch if MATIC could sustain the gains.
- Polygon price edges higher on Saturday.
- The price hovers near the critical support-turned-resistance $0.80 level.
- If the price closes above this level would it would be a turnaround for MATIC.
Polygon price trades in green
On the weekly chart, MATIC is forming lower lows and lower highs. Further, the price is trading below the 100-day exponential moving average.
Earlier MATIC gave a bearish impulse move from March 28 ($1.76) to June 13 ($0.380), with a more than 80% fall within just three months. However, the price makes a pullback from its lows of up to $(1.0440), where MATIC finds a strong resistance hurdle at the 100-day exponential moving average
Combined with the 50% Fibonacci retracement level, it makes a higher probability of sizeable downside momentum. If the price closes below 0.75 on a daily chart, then we can expect a fall of up to $0.70 followed by $0.65.
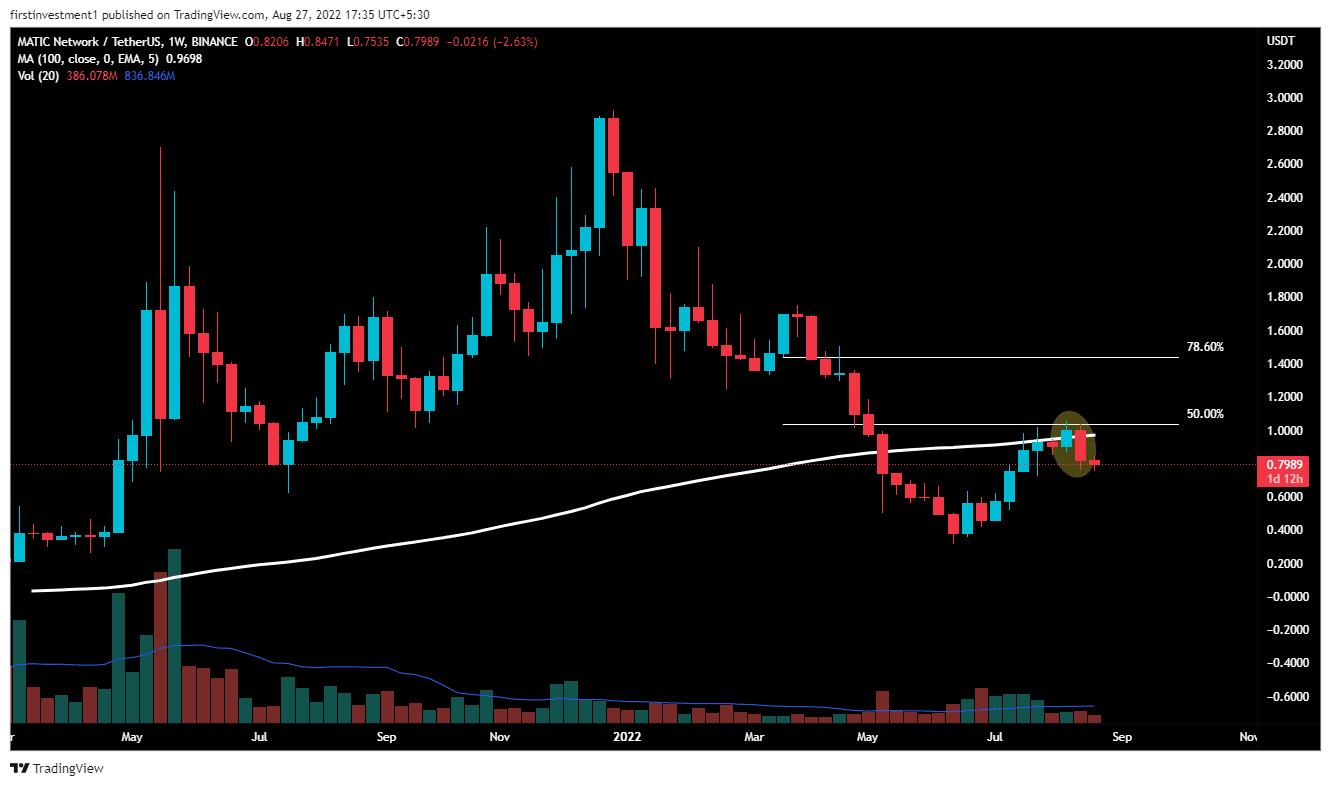
In addition to that, the formation of a bearish engulfing pattern confined the dominance of the sellers.
However, the formation of the Doji candlestick suggests the sellers might be losing out of steam. Still, it needs confirmation to make a trading decision.
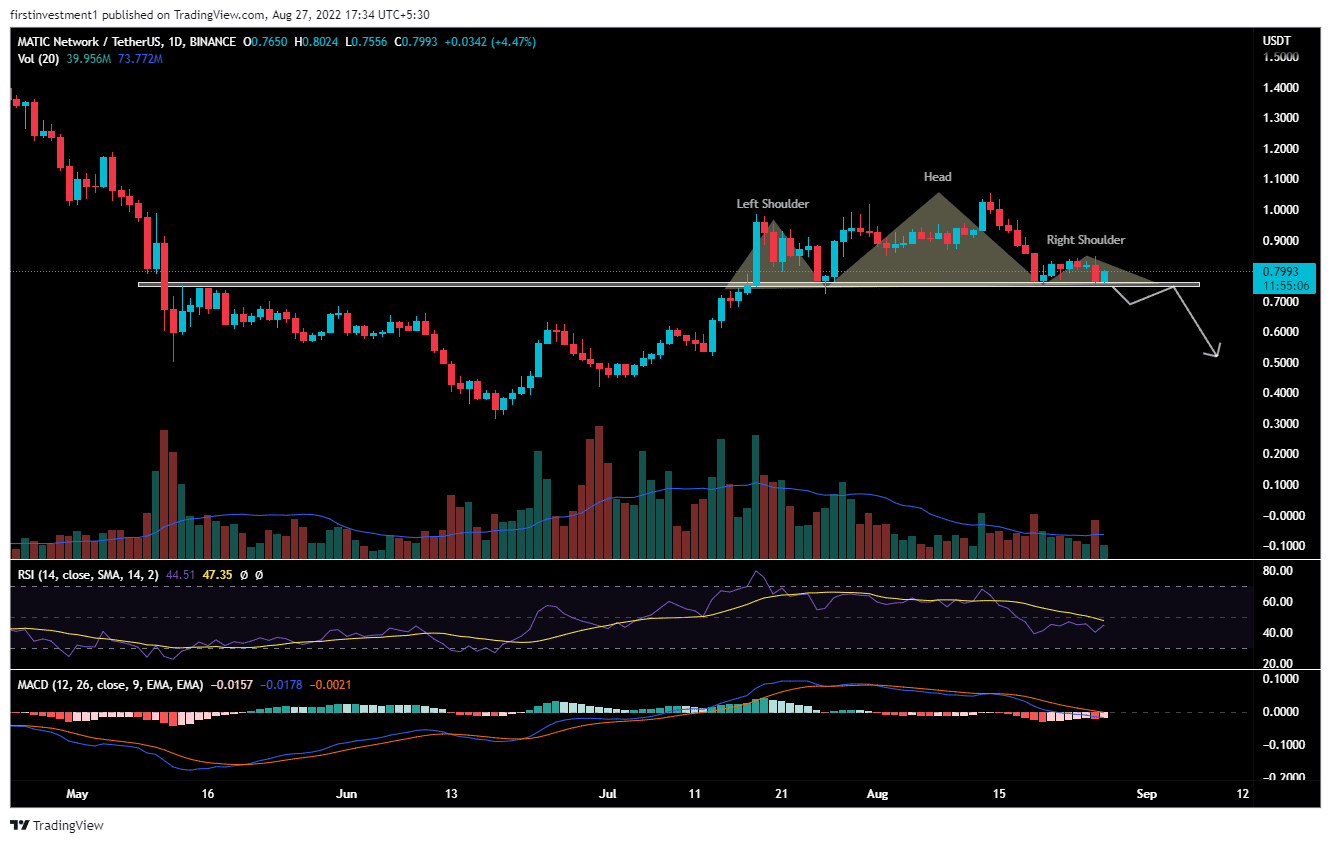
On the daily chart time frame, the price is taking reliable support at $0.7500, which earlier acted as a resistance. MATIC forms a “Head & Shoulder” pattern.
A double bottom structure near $0.7500 would result in a discount buying opportunity for the sidelined investors. The momentum oscillators could turn in the favor of bulls.
The RSI(14) is trading below 50. When the relative strength index is below 50, it generally means that the losses are greater than the gains. Any uptick in the indicator could strengthen the positive outlook.
Whereas, the MACD line crosses below the signal line below zero, indicating a bearish trend. However, the decreasing histogram suggests receding bearish momentum.
An acceptance above the session’s high would bring more gains with additional buying interest. On Moving higher, the first upside target could be found at $0.85.
On the other hand, if the price break below the Head $ Shoulder pattern’s neckline support, with rising volumes, then we can expect a good fall. If the price sustains below $0.75, then there is a higher chance of MATIC dropping toward $0.65.
The nearest support is $0.75, whereas the nearest resistance is $0.8500. There is a higher probability of the price to breaks its resistance level. The “Buy on the dip” opportunity is the best course of plan we can go with.
MATIC is sideways to mildly bullish on different time frames. Above $0.85 closing on the hourly time frame, we can put a trade on the buy side.
Play 10,000+ Casino Games at BC Game with Ease
- Instant Deposits And Withdrawals
- Crypto Casino And Sports Betting
- Exclusive Bonuses And Rewards


Why Trust CoinGape
CoinGape has covered the cryptocurrency industry since 2017, aiming to provide informative insights Read more…to our readers. Our journal analysts bring years of experience in market analysis and blockchain technology to ensure factual accuracy and balanced reporting. By following our Editorial Policy, our writers verify every source, fact-check each story, rely on reputable sources, and attribute quotes and media correctly. We also follow a rigorous Review Methodology when evaluating exchanges and tools. From emerging blockchain projects and coin launches to industry events and technical developments, we cover all facets of the digital asset space with unwavering commitment to timely, relevant information.

Related Articles


- Analyst Predicts Bitcoin Price Dip to $55K as ETFs See Outflows Amid Middle East Tensions
- Ethereum Co-founder Sparks $157M Sell-Off Fears as ETH Struggles Below $2k
- Analyst Predicts XRP Price Could Fall to $1 as XRP ETFs Record Net Weekly Outflows
- U.S.-Iran War: Trump Threatens to Hit Iran ‘Very Hard’ Today as Bitcoin Faces New Selling Pressure
- Crypto Market Weekly Recap: US-Iran War Steer Crypto Prices, Kraken Gets Fed Master Account, Tokenization Push March 2-6
- Dogecoin, Pepe coin, and Shiba Inu Price Prediction As BTC Crashes Below $70k
- Here’s Why Cardano Price Has Not Reclaimed $0.30
- Will XRP Price Crash as U.S. Nonfarm Payrolls Fell by 92,000 in February?
- Pi Network Price Eyes a 40% Surge as Pi Day Looms on March 14
- Top Reasons Why Circle Stock Price is Surging
- Gold Price Prediction as US-Iran War Hits the Second Week


