 Buy $GGs
MATIC Price Analysis: Ongoing MATIC Correction Is “Buy The Dip” Opportunity, Here’s Why


The short term MATIC price analysis showcases a correction phase in action. However, a bullish pattern in the 4-hour chart highlights the possibility of a bullish reversal. Nonetheless, traders must stay cautious in taking a side before the fruition of the pattern to avoid any traps in the chart.
Key technical points:
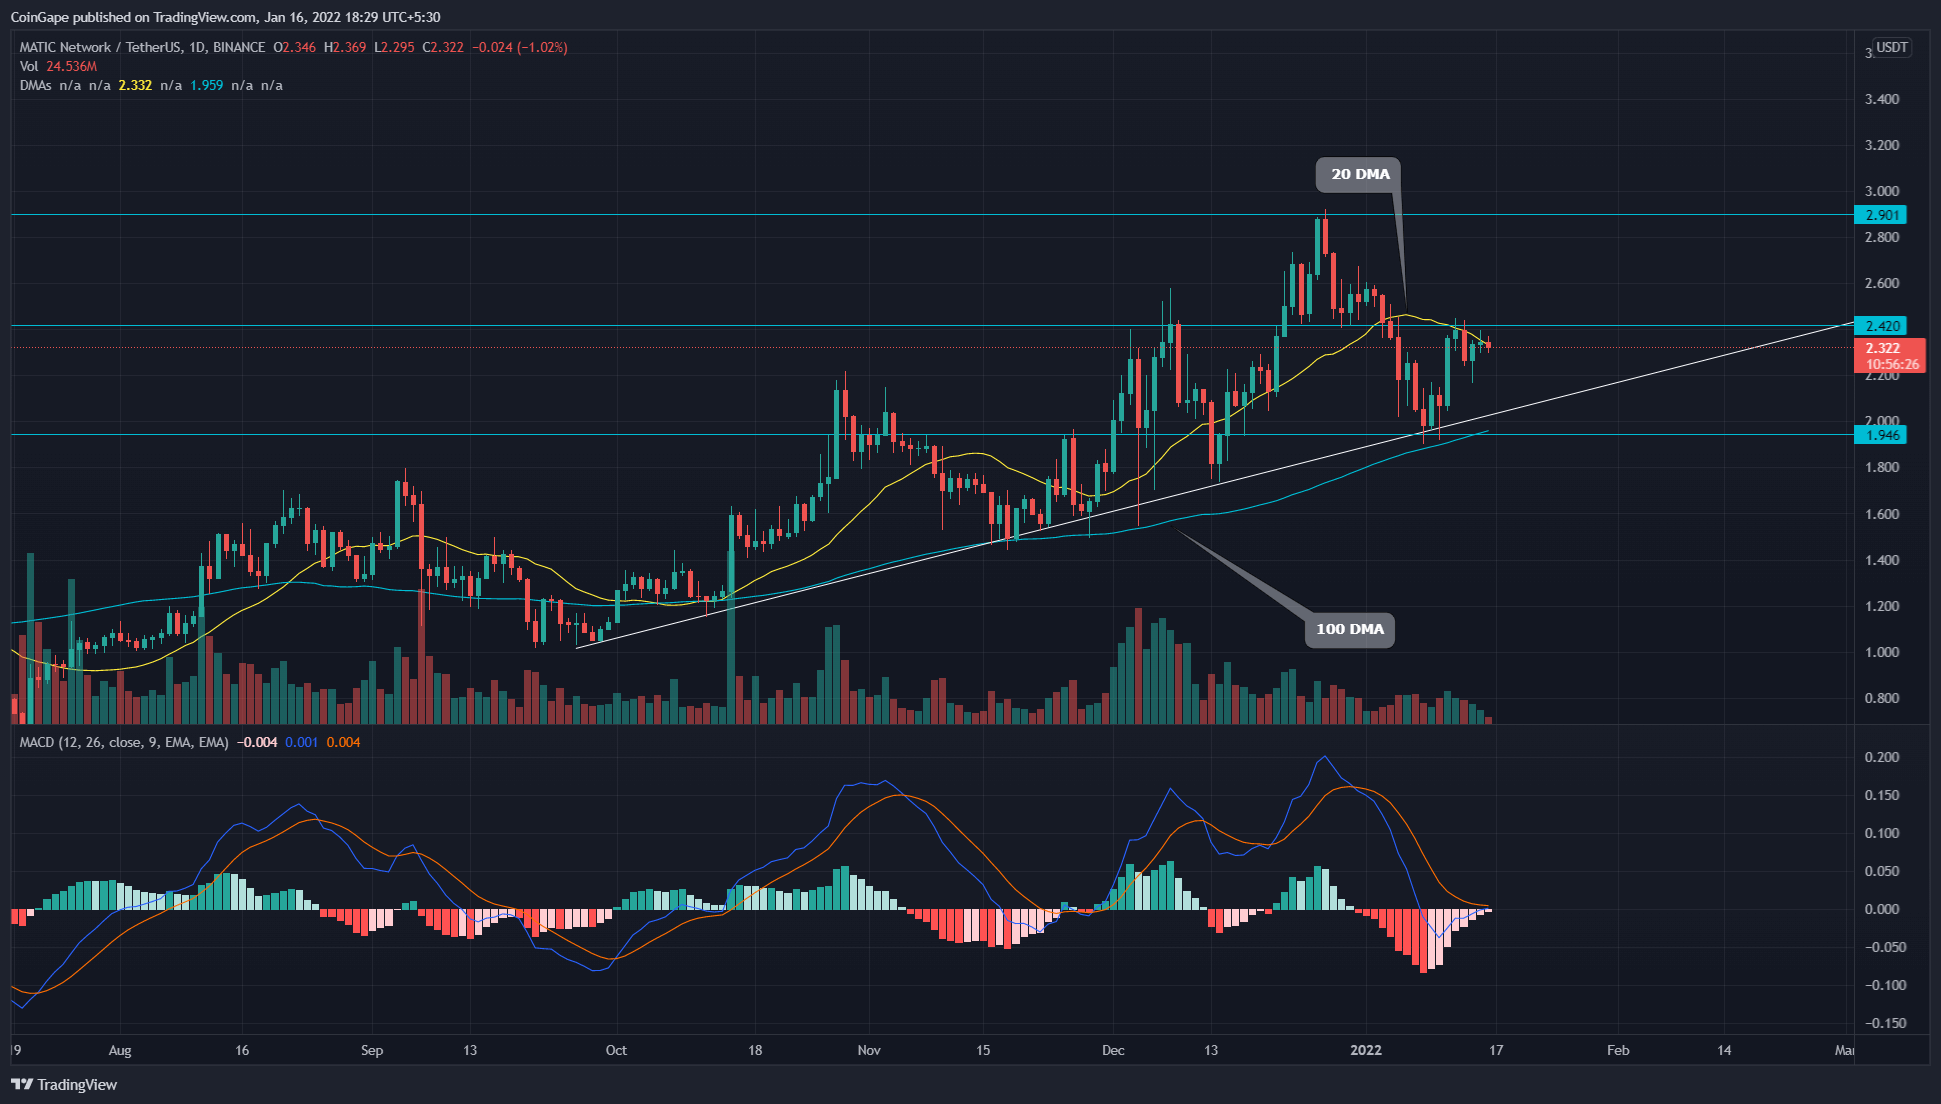
- The MATIC price struggles to rise above the 20-day DMA
- The selling pressure increases as the price hints at an evening star pattern formation
- The intraday trading volume in the MATIC coin is $1.21 Billion, indicating a 9.275% fall.
 Source- Tradingview
The MATIC price rose to the $2.5 resistance level after finding demand at the confluence of $2 level and the support trendline. However, the price action shows an evening star candle pattern justifying a 4% rejection from a high selling pressure area.
The support trendline maintains an uptrend resulting in the price jump of 20% from its inception. Therefore, the possible retracement can halt near the trendline.
Moreover, the 20-day DMA acts as a dynamic resistance keeping the recent bullish attack in check. However, the constant support from the 100-day DMA helps to carry an uptrend in action.
The Moving average convergence divergence shows a free fall in the MACD and signal lines in the daily chart. However, the falling distribution in the bearish histograms indicates a fall in underlying bearishness.
MATIC Price Action Hints Bullish Pattern Breakout
 Source-Tradingview
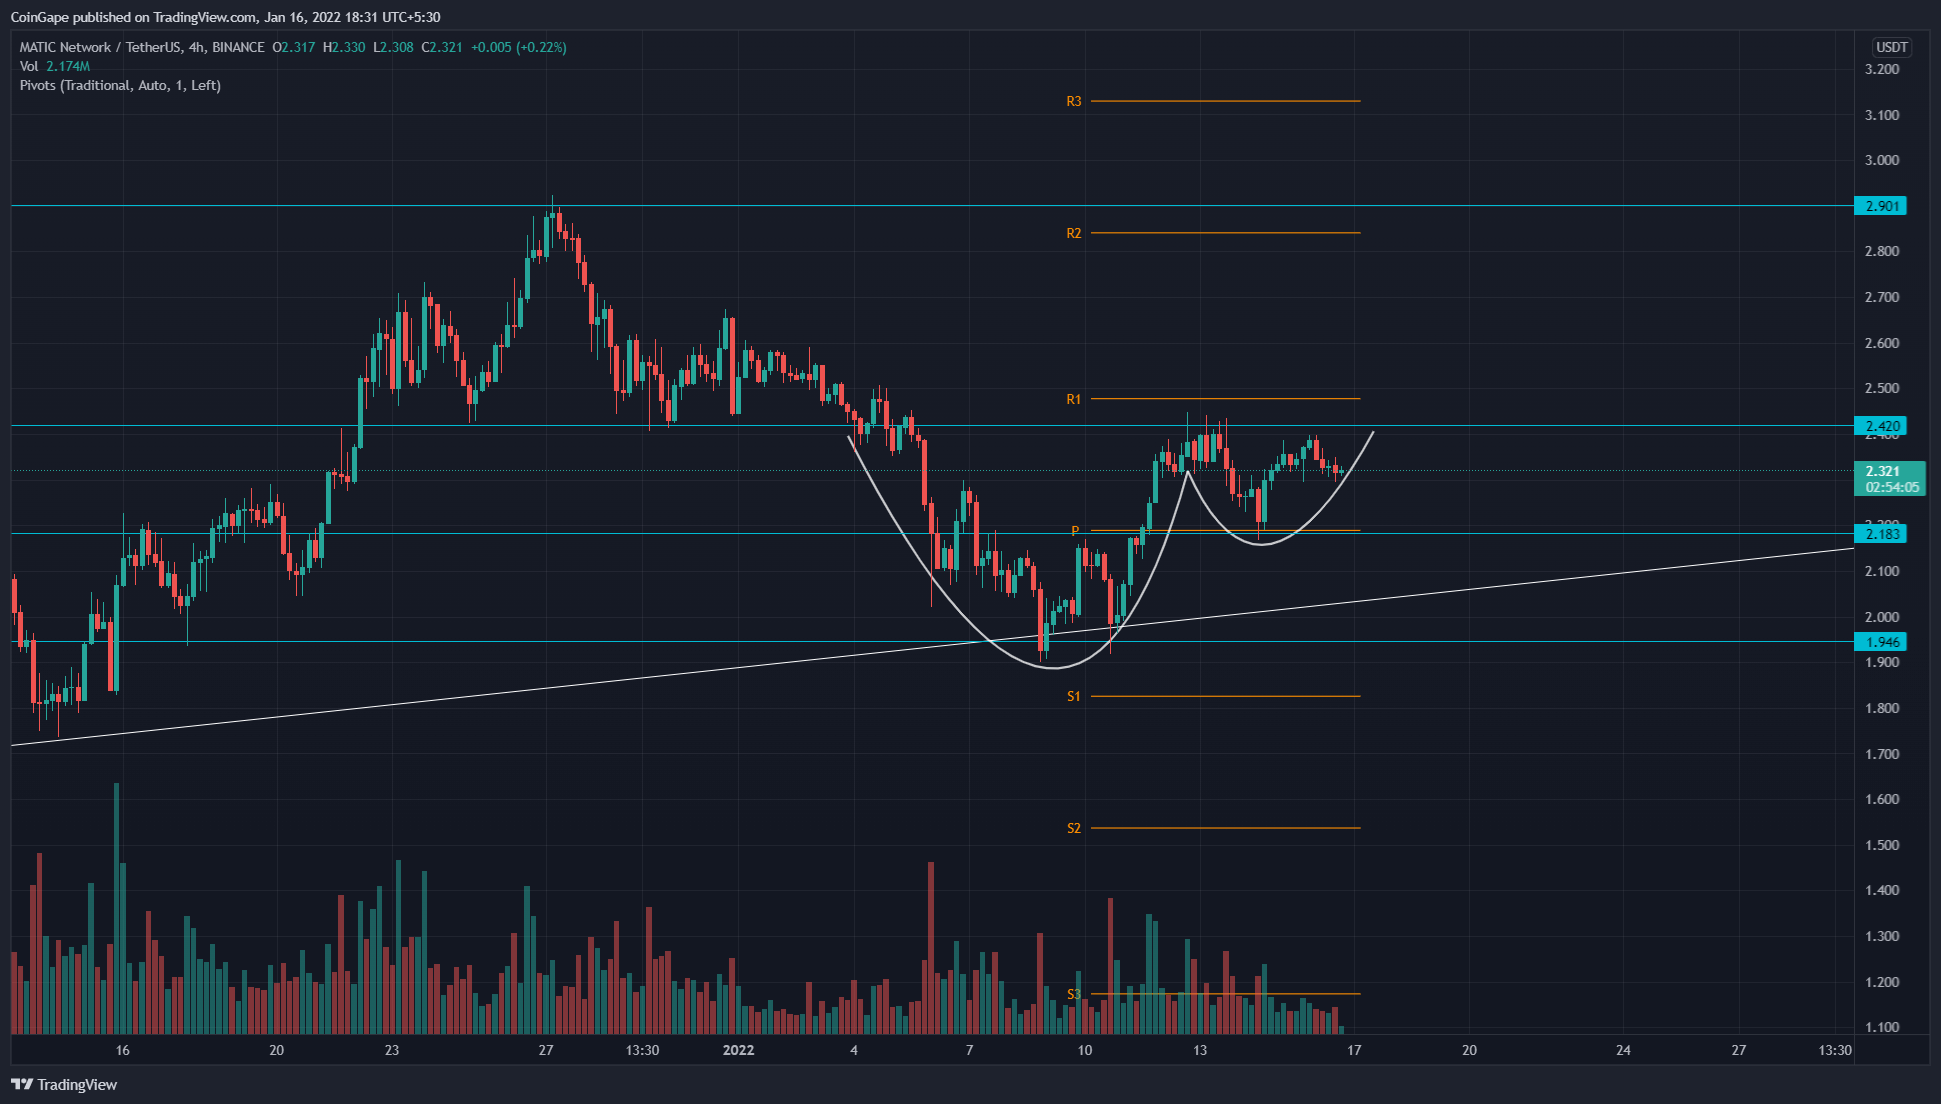
The MATIC price action forms a cup and handle pattern in the 4-hour chart. The neckline of the pattern is at the horizontal level of $2.40. Therefore, a price jump above the neckline will initiate a new bull run.
The decrease in trading volume during the handle formation of the pattern reflects trapping of momentum. Therefore, a breakout of either side will unleash the trapped momentum, and lead to a strong directional move.
The price action suggests the crucial high supply levels for MATIC price is at $2.84 following the neckline at $2.4 in the 4-hour chart. Meanwhile, the demand levels are at $2.2 and $1.8.
Play 10,000+ Casino Games at BC Game with Ease
- Instant Deposits And Withdrawals
- Crypto Casino And Sports Betting
- Exclusive Bonuses And Rewards


Why Trust CoinGape
CoinGape has covered the cryptocurrency industry since 2017, aiming to provide informative insights Read more…to our readers. Our journal analysts bring years of experience in market analysis and blockchain technology to ensure factual accuracy and balanced reporting. By following our Editorial Policy, our writers verify every source, fact-check each story, rely on reputable sources, and attribute quotes and media correctly. We also follow a rigorous Review Methodology when evaluating exchanges and tools. From emerging blockchain projects and coin launches to industry events and technical developments, we cover all facets of the digital asset space with unwavering commitment to timely, relevant information.

Related Articles


- Best Cross-Chain Swap Platforms in 2026 – Top 9 Picks Reviewed
- Crypto Traders Predict Oil Prices to Rally Above $100 as Iran War Enters Week 2
- Prediction Market Kalshi Faces Class Action Over Iran War-Linked Bets
- Binance Responds To U.S. Senate Probe, Denies Iran Sanctions Violations
- Fed Rate Cut Odds Jump Following Huge U.S. Jobs Report Miss
- Here’s Why Cardano Price Has Not Reclaimed $0.30
- Will XRP Price Crash as U.S. Nonfarm Payrolls Fell by 92,000 in February?
- Pi Network Price Eyes a 40% Surge as Pi Day Looms on March 14
- Top Reasons Why Circle Stock Price is Surging
- Gold Price Prediction as US-Iran War Hits the Second Week
- HOOD Stock Targets $100 as Robinhood Unveils Platinum Card and Advance Dividend Feature


