Polygon Price Prediction Hints Rally to $1 as $MATIC Breaks 22-month Downtrend


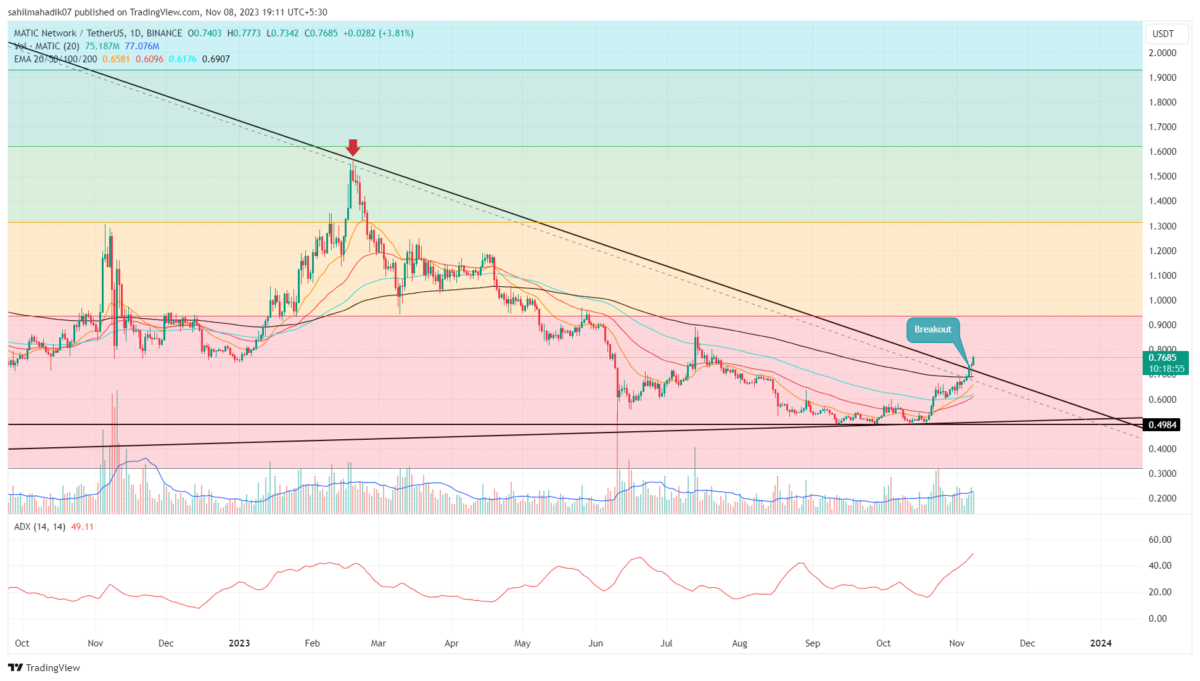
Polygon Price Prediction: The MATIC price has initiated a notable recovery pivoting upwards from the crucial support level at $0.5 in late October. Within a span of three weeks, the coin value has witnessed an impressive 52% escalation, advancing to the current trading figure of $0.766. This upward trajectory breached a longstanding descending resistance trendline, offering buyers suitable support to sustain higher grounds. Could this indicate the onset of a bullish phase?
Also Read: Robinhood CEO Bullish On Bitcoin ETF Amid European Expansion Plans
Trendline Breakout Hints Early Sign of Trend Reversal
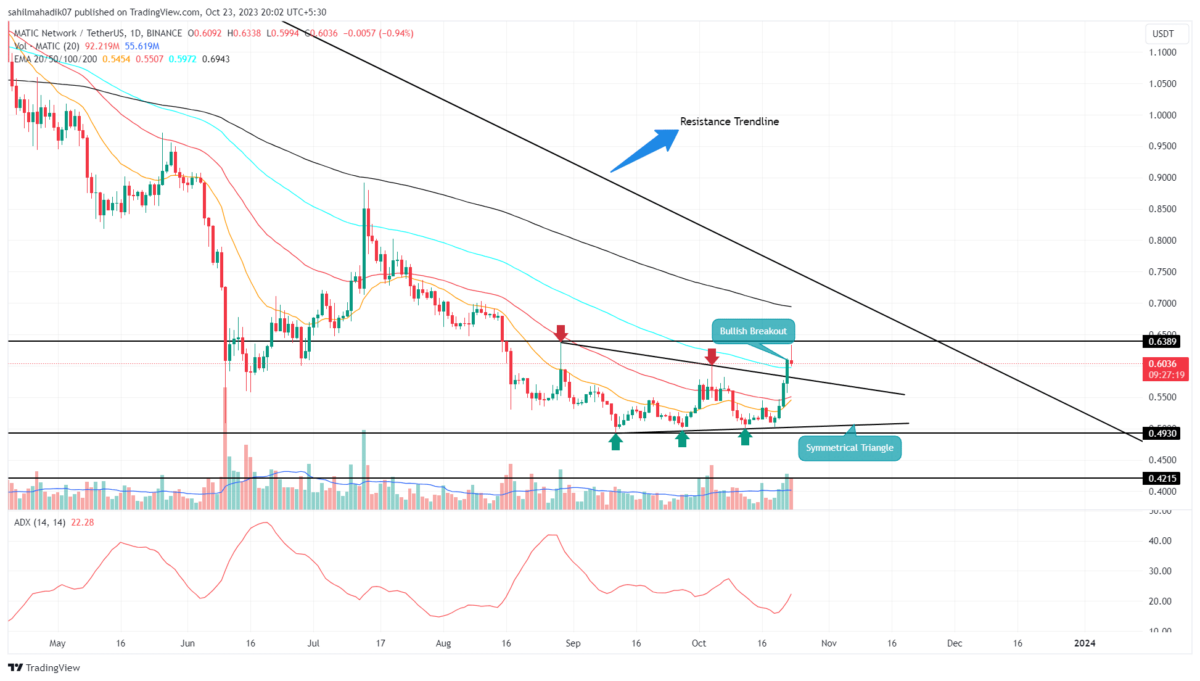
- The 50 and 100 EMA nearing a bullish crossover could bolster the buying pressure in the market.
- The rising MATIC price may face strong supply pressure around the $0.9 mark
- The intraday trading volume of the MATIC coin is $503 Million, showing a 50% gain.
 Source- Tradingview
On November 6th, the Polygon coin price gave a decisive break from a downsloping trendline, which carried a 22-month downtrend. Historical trends suggest that prior retests of this trendline typically trigger enhanced sell-offs, leading to notable market corrections.
Consequently, the recent break could be interpreted as a preliminary sign of a shift in market dynamics. This bullish notion is further substantiated by the appearance of two successive green candles on the daily chart, signaling a robust follow-through and the market’s resolve to prolong the recovery trend.
If the buying pressure persists, the MATIC price may rise 15% targeting the next key resistance zone at $0.09. As per the Fibonacci Retracement tool, the 23.6% level coincides with the aforementioned resistance, forming a significant barrier.
However, the bearish scenario could regain dominance unless the price surpasses the 50% Fibonacci level, which stands at $0.157.
MATIC vs BTC Performance
 Source: Coingape| Polygon Vs Bitcoin Price
The last 30 days’ projections indicate the Polygon coin price recovery has been outperforming the leading cryptocurrency, Bitcoin. While the BTC price is struggling to surpass the $36,000 mark, the MATIC price continues its bullish trajectory and is gaining higher ground. Thus, the aggressive players in the market can look at this asset to make fast trades.
- Average Directional Index: The ADX slope currently stands at 49%, suggesting that a minor pullback might be necessary to sustain the bullish momentum
- Exponential Moving Average: The MATIC price leap over the 200-day EMA indicates a turning tide in market sentiment, potentially in favor of the bulls.

Why Trust CoinGape
CoinGape has covered the cryptocurrency industry since 2017, aiming to provide informative insights Read more…to our readers. Our journal analysts bring years of experience in market analysis and blockchain technology to ensure factual accuracy and balanced reporting. By following our Editorial Policy, our writers verify every source, fact-check each story, rely on reputable sources, and attribute quotes and media correctly. We also follow a rigorous Review Methodology when evaluating exchanges and tools. From emerging blockchain projects and coin launches to industry events and technical developments, we cover all facets of the digital asset space with unwavering commitment to timely, relevant information.
24 Hours volume
$79.51K
Market Cap
$217.3M
Max Supply
10B

Related Articles


- Prediction Market News: Kalshi Faces New Lawsuit Amid State Regulatory Crackdown
- Will Bitcoin Crash To $58k or Rally to $75k After Hot PCE Inflation Data?
- Ripple’s RLUSD Gets Institutional Boost as SEC Eases Stablecoin Rules for Broker-Dealers
- Crypto Market Weekly Recap: BTC Waver on Macro & Quantum Jitters, CLARITY Act Deadline Fuels Hope, Sui ETFs Go Live Feb 16-20
- Robert Kiyosaki Adds To Bitcoin Position Despite Market Decline
- XRP Price Prediction As SBI Introduces Tokenized Bonds With Crypto Rewards
- Ethereum Price Rises After SCOTUS Ruling: Here’s Why a Drop to $1,500 is Possible
- Will Pi Network Price See a Surge After the Mainnet Launch Anniversary?
- Bitcoin and XRP Price Prediction As White House Sets March 1st Deadline to Advance Clarity Act
- Top 3 Price Predictions Feb 2026 for Solana, Bitcoin, Pi Network as Odds of Trump Attacking Iran Rise
- Cardano Price Prediction Feb 2026 as Coinbase Accepts ADA as Loan Collateral


