 Buy Presale
Polygon Price Prediction: Is $MATIC Recovery Heading to $0.6?


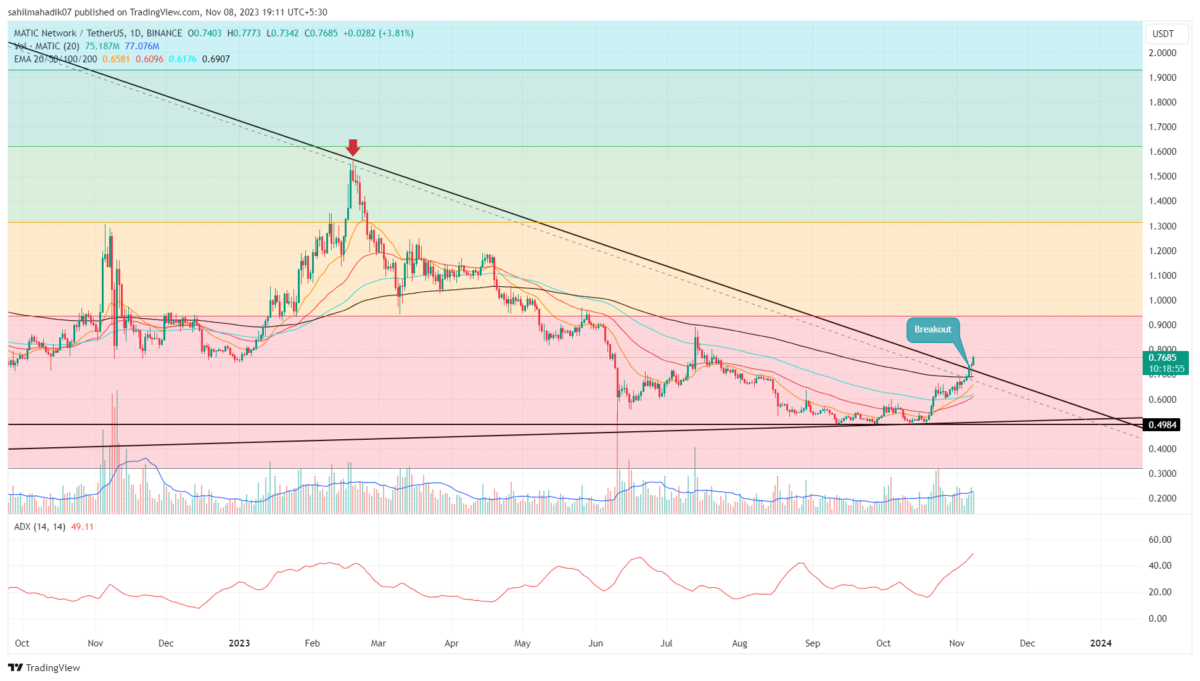
The MATIC price has recently shown signs of bottoming out, as the price has entered into a sideways movement above the $0.5 support level. On the daily chart, this sideways movement has taken the form of a symmetrical triangle, a pattern that’s often indicative of a period of consolidation before a larger move.
Also Read: Coinbase No Longer Supports pUSDC withdrawals, Supports Native USDC on Polygon
Is $0.6 Within Reach?
- The MATIC price needs a breakout from the triangle pattern to trigger a direction trend.
- The $0.5 level stands as a strong support zone.
- The intraday trading volume of the MATIC coin is $271 Million, showing a 5% loss.
 Source- Tradingview
Amid the recent uptick in the crypto market, the Polyogon coin price rebounded from the lower trendline of the triangle pattern on October 30. This third reversal from the support trendline and earlier marked two reversals from the resistance trendline reflect the strong influence this pattern has on market participants.
So far, this price reversal has surged the coin by 4.3% higher to the current trade price of $0.52. Under the technical setup of this symmetrical triangle, a bullish reversal within the triangle pattern should hit the overhead trendline, indicating the price is poised for a further 9% surge.
However, until this pattern is intact, the polygon coin price may continue to waver in a sideways trend. An optimistic scenario would see a bullish breakout from the upper trendline, potentially propelling the MATIC price to $0.649, which would represent a total gain of about 22% from its current levels.
[converter id=”matic-polygon” url=”https://coingape.com/price/converter/polygon-to-usd/?amount=1″]
Can MATIC Price Resume Prior Downtrend?
While the demand pressure around the $0.5 psychological support should bolster buyers for a new recovery, it is crucial to note that the symmetrical triangle pattern often supports the continuation of the prevailing trend which is currently bearish. Thus, if the current price shows a breakdown below the pattern support trend and $0.5, the MATIC price would be settled for a major correction
- Bollinger band: An uptick in the lower band of the Bollinger band indicator would offer an additional layer of support at the triangle’s lower boundary.
- Directional Movement Index: A bullish crossover between the DI+(blue) and DI-(orange) low reflects a suitable moment for upcoming recovery.
Play 10,000+ Casino Games at BC Game with Ease
- Instant Deposits And Withdrawals
- Crypto Casino And Sports Betting
- Exclusive Bonuses And Rewards


Why Trust CoinGape
CoinGape has covered the cryptocurrency industry since 2017, aiming to provide informative insights Read more…to our readers. Our journal analysts bring years of experience in market analysis and blockchain technology to ensure factual accuracy and balanced reporting. By following our Editorial Policy, our writers verify every source, fact-check each story, rely on reputable sources, and attribute quotes and media correctly. We also follow a rigorous Review Methodology when evaluating exchanges and tools. From emerging blockchain projects and coin launches to industry events and technical developments, we cover all facets of the digital asset space with unwavering commitment to timely, relevant information.

Related Articles


- Ripple Bets On AI Boom With Strategic Investment In AI Agent Infrastructure Startup
- Prediction Market News: Kalshi Fines MrBeast Associate Over Insider Trading Amid State Crackdown
- CLARITY Act: Banks, Crypto Yet To Agree On New Crypto Bill Draft As March 1 Deadline Looms
- Michael Saylor Predicts $50T From Bonds Could Flow Into Bitcoin Ecosystem as Digital Credit Evolves
- Bitcoin Treasury Firm GD Culture Authorizes Sale of 7,500 BTC as Expert Warns Of More ‘Pain’
- Dogecoin, Cardano, and Chainlink Price Prediction As Crypto Market Rebounds
- Will Solana Price Rally to $100 If Bitcoin Reclaims $72K?
- XRP Price Eye $2 Rebound as On-Chain Data Signals Massive Whale Accumulation
- Ethereum Price Reclaims $2K- New Rally Ahead or a Temporary Bounce?
- COIN Stock Price Prediction as Wall Street Pros Forecast a 62% Surge
- Cardano Price Signals Rebound as Whales Accumulate 819M ADA


