
Polygon Price Prediction: Will Current Correction Push $MATIC Below $0.5?


The Polyong coin price has majorly traded sideways throughout September, indicating an indecisiveness between buyers and sellers. Nevertheless, this lateral trajectory appears to be on a collision course with a key resistance trendline reclaimed intact since February 2023. The arrival at this critical juncture could catalyze an uptick in selling pressure, prompting traders to question: will Matic lose the $0.5 level amid the anticipated correction?
Also Read: Forget BlackRock, Here’s Why Gaming Industry Could Drive the Next Bitcoin Bull Run
Overhead Supply Hints Prolong Correction
- A potential reversal from the downsloping trendline may dump the price below $0.5
- A bullish breakout from the above trendline may signal a trend reversal
- The intraday trading volume of the MATIC coin is $195 Million, showing a 4.77% gain.
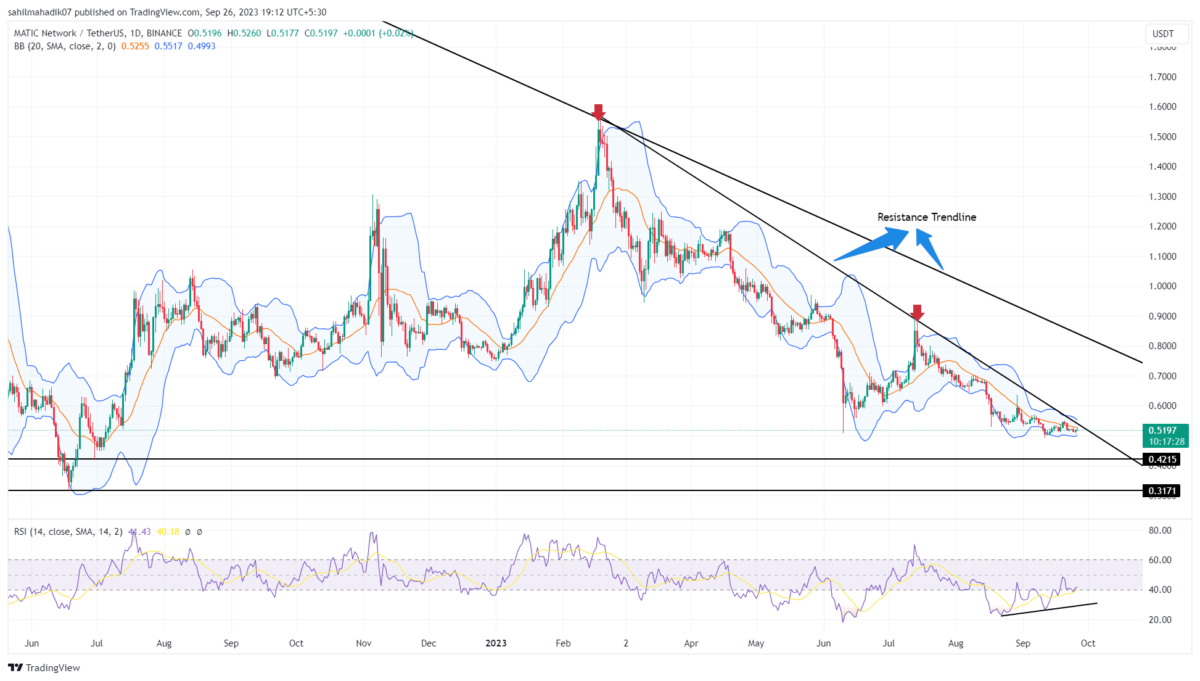
 Source- Tradingview
Since mid-July, the MATIC price has witnessed a steep correction, plummeting from a $0.89 high to its current price of $0.51—a 41.8% loss that effectively wiped out the gains made during the June-July rally. While the current market sentiment remains uncertain, the coin price is moving sideways and is about to hit a downsloping resistance trend line.
With this altcoin approaching a long-standing downtrend resistance line, it’s reasonable to anticipate increased selling pressure.
This third reversal from this trendline could trigger an 18% price decline, potentially dragging the coin price down to the next key support level at $0.42.
[converter id=”matic-polygon” url=”https://coingape.com/price/converter/polygon-to-usd/?amount=1″]
Can MATIC Price Recover Back to $0.69?
For those bullish on Polygon’s native coin, patience could be a virtue at this point. A daily close above the aforementioned resistance trendline would signify a pivotal shift in market sentiment, providing the bulls with suitable support to initiate a recovery rally. In the event of a successful breakout, the MATIC price could target initial resistance at $0.63, followed by a more ambitious target of $0.69
- Bollinger Band: The constricted range of the Bollinger Band indicator suggests heightened volatility for the asset in question.
- Relative Strength Index: The upward trajectory of the RSI slope signals that buyers are making efforts to overcome the overhead resistance level.

Why Trust CoinGape
CoinGape has covered the cryptocurrency industry since 2017, aiming to provide informative insights Read more…to our readers. Our journal analysts bring years of experience in market analysis and blockchain technology to ensure factual accuracy and balanced reporting. By following our Editorial Policy, our writers verify every source, fact-check each story, rely on reputable sources, and attribute quotes and media correctly. We also follow a rigorous Review Methodology when evaluating exchanges and tools. From emerging blockchain projects and coin launches to industry events and technical developments, we cover all facets of the digital asset space with unwavering commitment to timely, relevant information.
24 Hours volume
$22.96K
Market Cap
$182.15M
Max Supply
10B


- Elon Musk’s SpaceX Could File for IPO This Week, Tokenized Stock Falls
- Bitget Blends Crypto Trading With MotoGP Brazil Fan Experience Push
- ZachXBT Reports Russian OTC Broker Allegedly Laundered $4.7M+ in Crypto
- 3 Top Reasons Why Coinbase Stock is Sliding Today?
- Bernstein Says Bitcoin Has Bottomed Even as U.S.-Iran Peace Talks Remain Uncertain
- Dogecoin, Shiba Inu, and Pepe Coin Price Outlook as Markets Rise on U.S.–Iran Temporary Pause
- Bittensor (TAO) Price Soars 80% MoM Outperforming Bitcoin- Is It A Good Time to Buy?
- Top Factors Behind Shiba Inu (SHIB) Price Surging Today
- Gold Vs BTC: Bitcoin Outperforms Gold by 23% – Is $75K Next Amid Trump’s Five Day Pause
- Crypto Stocks to Watch As Trump Issues 48-Hour Iran Ultimatum- CRCL, COIN, and MSTR Price Analysis
- XRP Price Prediction Ahead of March 27 SEC Spot ETF Decision


