MATIC Price Today: Bulls Rejects Near $2.0, Face Downside Risk Of 21%


Polygon (MATIC) price looks exhausted after rallying 60% from the January lows. The price bounced back after testing the lows on January 24 since then, MATIC has been in the continuous upside momentum and is now slamming at the upper trend line of the downside channel.
- Polygon price trades lower on Thursday inside the downward channel.
- The price face short-term resistance at $2.10, expect more downside below this level.
- A decisive close above the mentioned level could reverse the current trend.
As of printing, MATIC/USD is trading at $1.98, down 3.38% for the day. The current market cap of polygon stands at $14,875,151,119 as per the CoinMarketCap.
MATIC price took a breather at the current level
On the daily chart, Polygon (MATIC) price consolidated near the $1.50 demand zone, which has been utilized by the investors to engage in the current leg up. MATIC has depreciated nearly 55% from the highs made in November at $2.92.
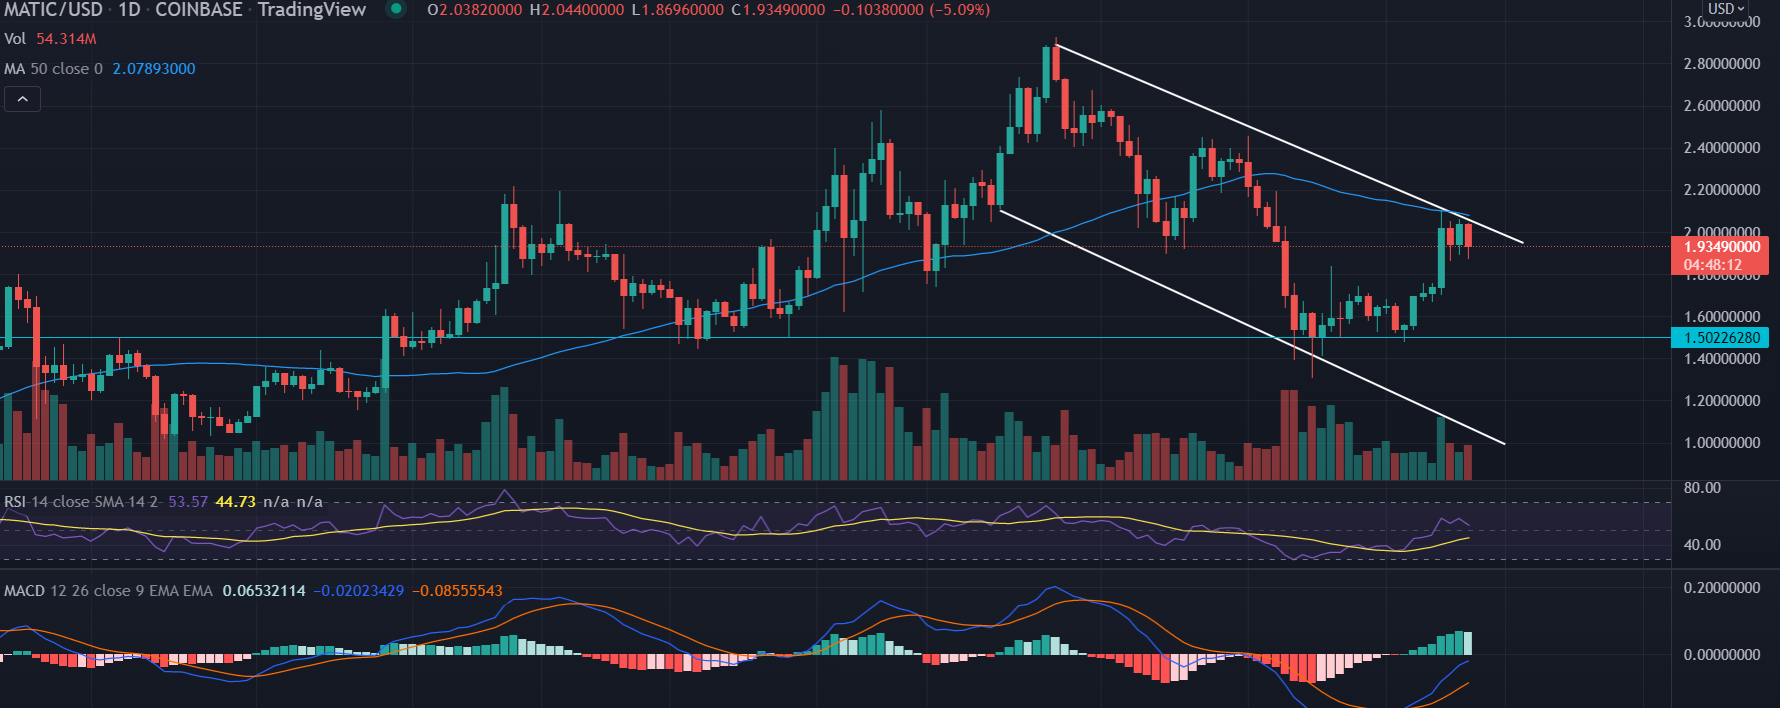
MATIC has been trading in the downtrend channel with the lower high and lower low formation. Bulls have been rejected three times near the upper trend line of the mentioned channel. Investors loose their patience every time approached the higher levels and pulled their funds to book profits.
The price has been struggling below the 50-day SMA (Simple Moving Average) at $2.07.
Looking at the previous price action there is a higher probability that MATIC would take a U-turn from the current level and would retreat toward the $1.50 significant level.
A breakthrough of this foothold would invite more sellers toward the $1.20 level. This would be the continuation of the lower high and lower low formation, a classic downside pattern.
On the flip side, the Bulls engaged in continuous efforts to push above the bearish sloping line. An acceptance above the 50-day SMA would bring the buyers back into the limelight with the first upside target of $2.20.
Technical indicators:
RSI: The Daily Relative Strength Index (RSI) reads at 50 with a bearish bias.
MACD: The Moving Average Convergence Divergence (MACD) still trades below the midline.

Why Trust CoinGape
CoinGape has covered the cryptocurrency industry since 2017, aiming to provide informative insights Read more…to our readers. Our journal analysts bring years of experience in market analysis and blockchain technology to ensure factual accuracy and balanced reporting. By following our Editorial Policy, our writers verify every source, fact-check each story, rely on reputable sources, and attribute quotes and media correctly. We also follow a rigorous Review Methodology when evaluating exchanges and tools. From emerging blockchain projects and coin launches to industry events and technical developments, we cover all facets of the digital asset space with unwavering commitment to timely, relevant information.

Related Articles


- Bitcoin Price Today As Bulls Defend $65K–$66K Zone Amid Geopolitics and Tariffs Tensions
- XRP Realized Losses Spike to Highest Level Since 2022, Will Price Rally Again?
- Crypto Market Rises as U.S. and Iran Reach Key Agreement On Nuclear Talks
- Trump Tariffs: U.S. Raises Global Tariff Rate To 15% Following Supreme Court Ruling
- Bitwise CIO Names BTC, ETH, SOL, and LINK as ‘Mount Rushmore’ of Crypto Amid Market Weakness
- Pi Network Price Prediction: How High Can Pi Coin Go?
- Dogecoin Price Prediction Feb 2026: Will DOGE Break $0.20 This month?
- XRP Price Prediction As SBI Introduces Tokenized Bonds With Crypto Rewards
- Ethereum Price Rises After SCOTUS Ruling: Here’s Why a Drop to $1,500 is Possible
- Will Pi Network Price See a Surge After the Mainnet Launch Anniversary?
- Bitcoin and XRP Price Prediction As White House Sets March 1st Deadline to Advance Clarity Act


