 Buy $GGs
XRP Price Analysis: XRP Price Could Reach $1.1 Mark As Price Chart Forms Symmetrical Triangle Pattern


The overall trend for the XRP price is still sideways. The recent correction in price has plunged the coin to a crucial support level of $0.7. However, the technical chart shows the formation of a symmetrical triangle pattern, whose breakout could initiate a new trend in XRP price.
Key technical points:
- The RSI displays bullish divergence in the daily time frame chart
- The intraday trading volume in the XRP coin is $1.74 Billion, indicating a 3.69% hike.
 Source- Tradingview
The last time we covered an article on XRP price analysis, the short-term downtrend plunged the price to the $0.7 support. The technical chart showed several lower price rejection candles, indicating the intense buying pressure.
Moreover, the XRP price is also at the support trendline of a symmetrical triangle pattern. Following this pattern, the price could bounce back from this support and rally towards the overhead resistance(approx. $1.1).
Moving in a sideways trend, the longer EMA lines 100 and 200 EMA have started to fatten. However, as for now, the price is trading below these EMAs, indicating a bearish trend.
The daily Relative Strength Index (43) is steadily approaching the neutral line. Moreover, the chart also shows bullish divergence, providing more confirmation for a bullish reversal.
XRP Price Could Retest The $0.7 Support
 Source- Tradingview
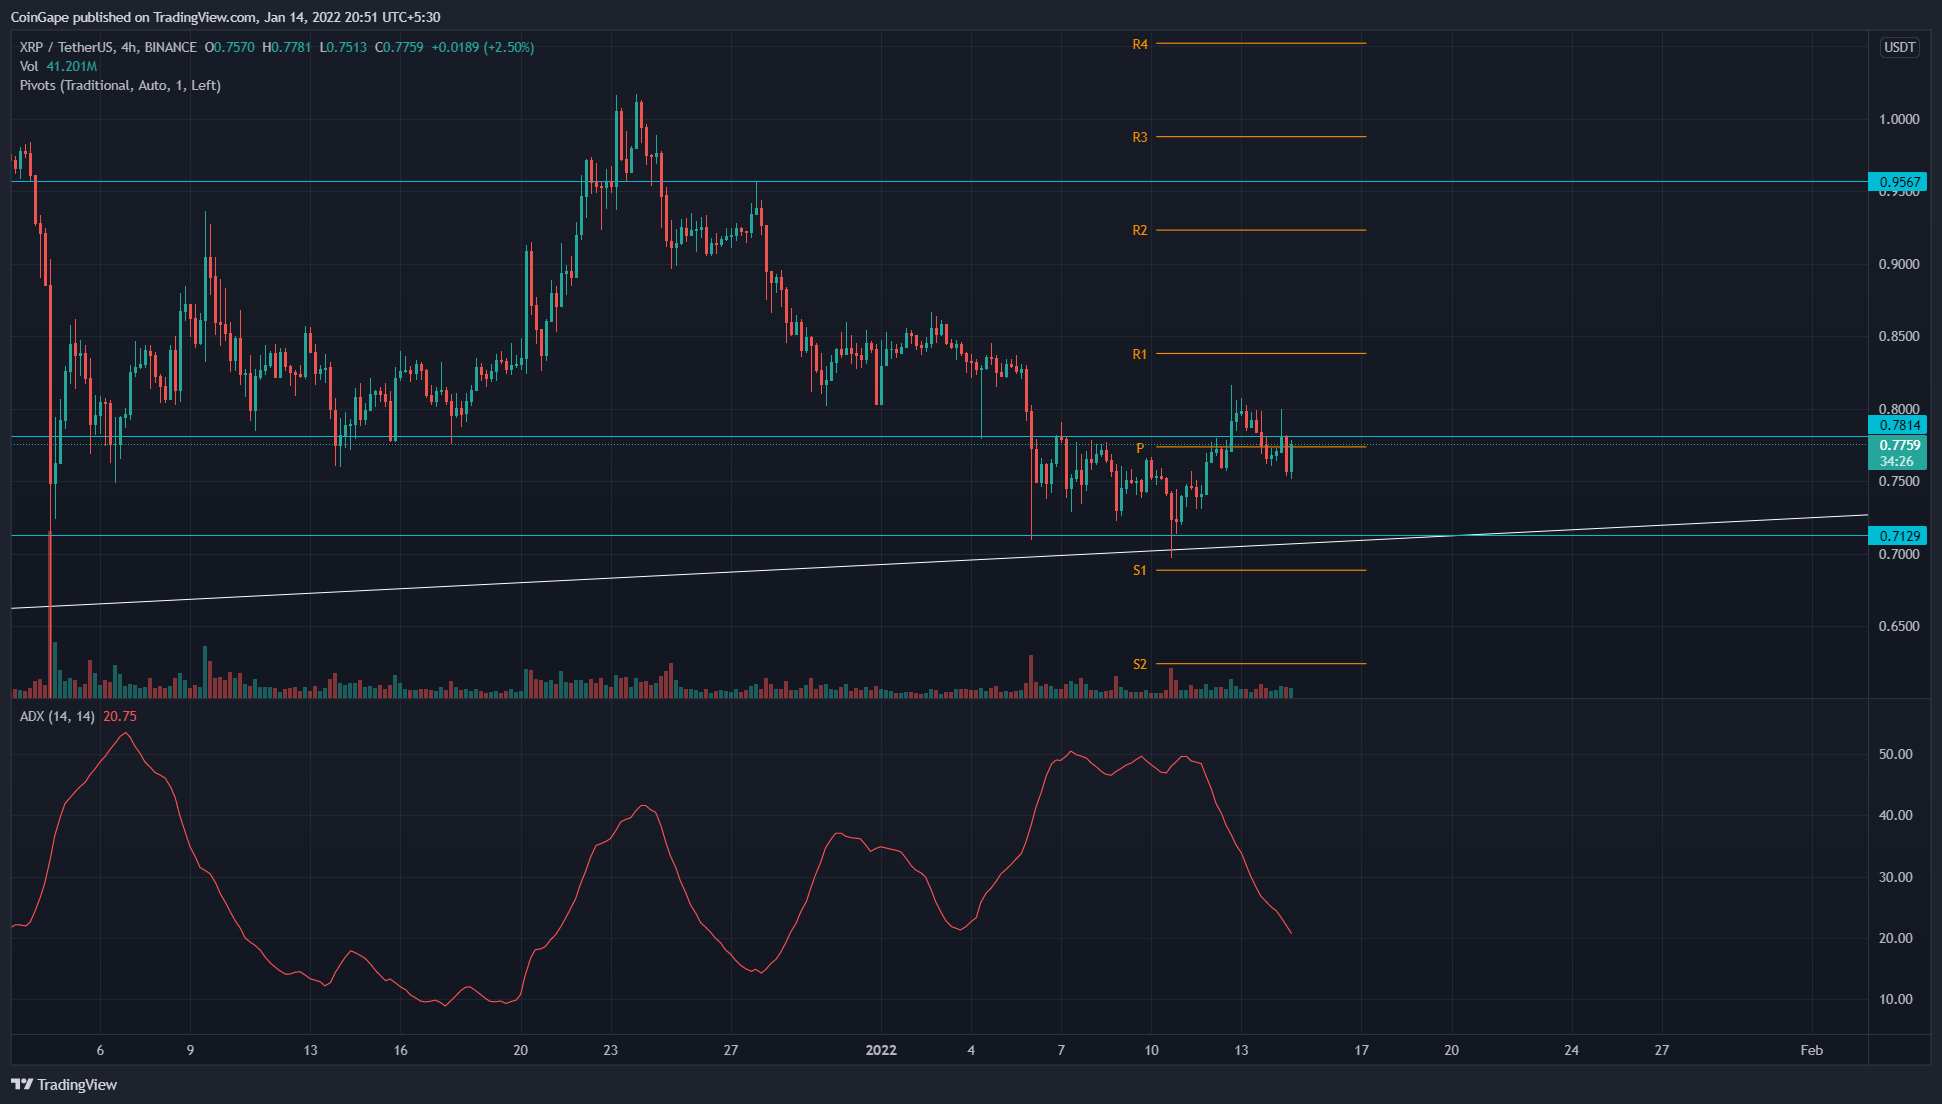
On January 10th, the Ripple coin price bounced back from the $0.7 support with a morning star candle pattern. The price started to rally and breached the nearest resistance of $0.78. However, the price couldn’t sustain above this level and dropped below the breaking point.
If the price sustains below the $0.78 resistance, the coin might retest the bottom level for another support before it could initiate a proper rally.
The average directional movement index(20) slope moving lower displays the losing momentum in selling pressure. The traditional pivot level indicating the overhead resistance for XRP is $0.776, followed by 0.838. On the flip side, the support levels are $0.688 and $0.62.
Play 10,000+ Casino Games at BC Game with Ease
- Instant Deposits And Withdrawals
- Crypto Casino And Sports Betting
- Exclusive Bonuses And Rewards


Why Trust CoinGape
CoinGape has covered the cryptocurrency industry since 2017, aiming to provide informative insights Read more…to our readers. Our journal analysts bring years of experience in market analysis and blockchain technology to ensure factual accuracy and balanced reporting. By following our Editorial Policy, our writers verify every source, fact-check each story, rely on reputable sources, and attribute quotes and media correctly. We also follow a rigorous Review Methodology when evaluating exchanges and tools. From emerging blockchain projects and coin launches to industry events and technical developments, we cover all facets of the digital asset space with unwavering commitment to timely, relevant information.

Related Articles


- US-Iran War: Reports Confirm Bombings In UAE, Bahrain and Kuwait As Crypto Market Makes Recovery
- XRP Price Dips on US-Iran Conflict, But Capitulation Signals March Rebound
- Crypto Market at Risk as U.S.–Iran War Threatens Inflation With Oil Price Surge
- Polymarket U.S.–Iran Strike Bets Fuel Insider Trading Speculation as Crypto Traders Net $1.2M
- Cardano’s DeFi TVL Climbs as USDCx Stablecoin Launches on Network
- Circle (CRCL) Stock Price Prediction as Today is the CLARITY Act Deadline
- Analysts Predict Where XRP Price Could Close This Week – March 2026
- Top Analyst Predicts Pi Network Price Bottom, Flags Key Catalysts
- Will Ethereum Price Hold $1,900 Level After Five Weeks of $563M ETF Selling?
- Top 2 Price Predictions Ethereum and Solana Ahead of March 1 Clarity Act Stablecoin Deadline
- Pi Network Price Prediction Ahead of Protocol Upgrades Deadline on March 1


