 Buy $GGs
Rising Stellar Price Aims For $0.13 Mark; Buy Now?


The rising Stellar (XLM) price projects a recovery possibility with a double bottom pattern at the $0.1 mark. With sustained buying, the bulls will retest the neckline resistance of $0.15 after a 3.3% rally. However, this low volume recovery lessens the confidence for a bullish breakout, and thus, the interested buyer should wait for a daily candle closing above neckline.
Key points:
- A double bottom pattern will assist buyers in rechallenging the $0.15 resistance
- A possible reversal from the neckline resistance will invalidate the bullish pattern
- The intraday trading volume in the XLM is $107.9 Million, indicating a 31.4% gain.
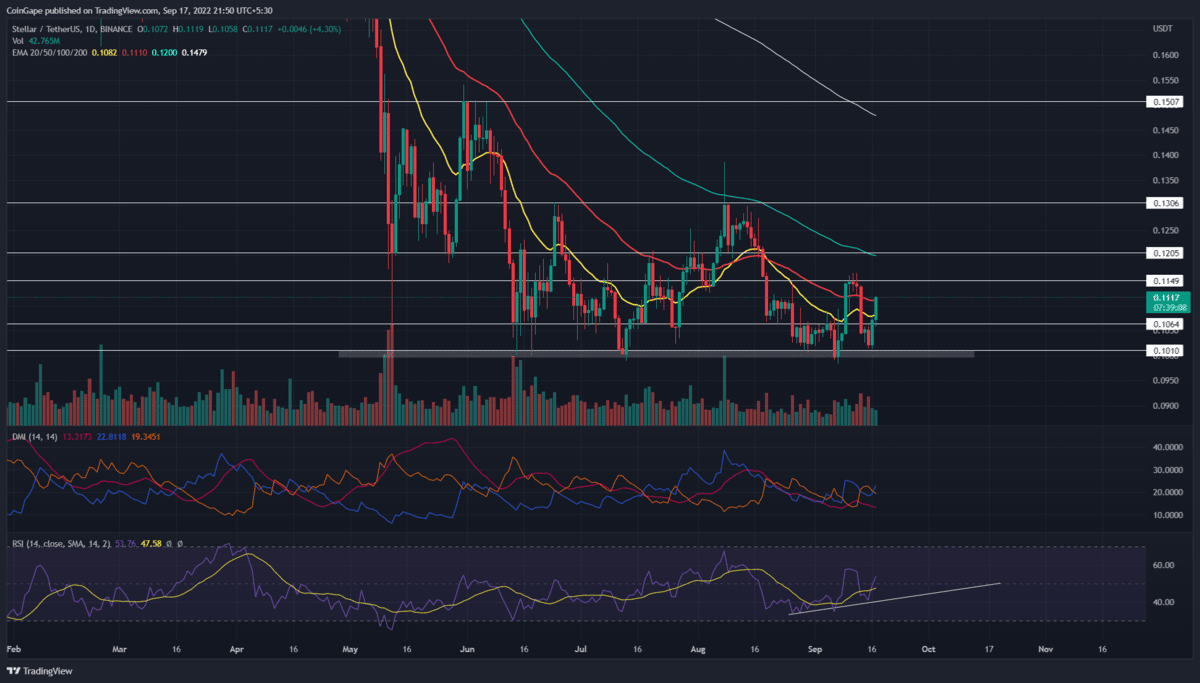
 Source- Tradingview
The XLM/USDT pair has been in a range-bound rally for the past three months. Furthermore, the $0.13 resistance and $0.1 support acted as the crucial barrier, which limited the price action to a confined range.
Amid the recent sell-off in the crypto market, the XLM price revisited the bottom support of $0.1. However, the price rebounded from this support with a massive bullish candle, indicating the traders are still actively buying at this level.
This reversal indicates a new bull cycle within this range, which sets a potential bull run to a range resistance of $0.13. Though the destination is marked, the Stellar price currently trades at $0.11 and is gradually rising to the $0.15 supply zone.
Concerning this resistance, the daily technical chart shows a double bottom pattern formation in the daily time frame chart. In response to this pattern, the buyers should surpass this neckline resistance.
A breakout entry from the $0.115 resistance should accelerate the bullish momentum and drive the prices 14% higher to the $0.13 resistance.
However, the volume activity lags despite a strong recovery, indicating a slight weak in bullish momentum. A bearish reversal from the $0.115 resistance will keep the prices wavering at the $0.1 bottom support.
Technical Indicator
RSI: the XLM buyers maintain an uptrend in the underlying bullishness evident by the ascending trendline highlighting the Bullish divergence. Therefore, the indicator signals an Upcoming breakout entry opportunity for sideline buyers.
DMI indicator: the Bullish crossover in the DI lines reverses the bearish alignment quickly after the previous event, sabotaging the trend control. However, the falling trend momentum evident by the falling ADX line questions the breakout rally’s strength.
- Resistance levels: $0.115 and $0.12
- Support levels: $0.1064 and $0.1
Play 10,000+ Casino Games at BC Game with Ease
- Instant Deposits And Withdrawals
- Crypto Casino And Sports Betting
- Exclusive Bonuses And Rewards


Why Trust CoinGape
CoinGape has covered the cryptocurrency industry since 2017, aiming to provide informative insights Read more…to our readers. Our journal analysts bring years of experience in market analysis and blockchain technology to ensure factual accuracy and balanced reporting. By following our Editorial Policy, our writers verify every source, fact-check each story, rely on reputable sources, and attribute quotes and media correctly. We also follow a rigorous Review Methodology when evaluating exchanges and tools. From emerging blockchain projects and coin launches to industry events and technical developments, we cover all facets of the digital asset space with unwavering commitment to timely, relevant information.

Related Articles


- Indiana Signs Bitcoin Bill Into Law Allowing Crypto in Retirement Plans
- ‘Time to Act Is Now’: CFTC Chief Pushes Swift Passage of CLARITY Act
- Trump Tells Congress to Pass Crypto Market Bill ‘ASAP,’ Blasts Banks for Stalling
- BTC Price Bounces as Spot Investors Buy The Dip Amid Iran War Jitters
- CFTC Chief Mike Selig Signals US Crypto Perpetual Futures Rollout in Coming Weeks
- Gold Price Prediction March 2026: Rally, Crash, or Record Highs?
- RIOT Stock Prediction as Needham, Piper Sandler Slash Target After Earnings
- Cardano Price Outlook As Charles Hoskinson Warns Over CLARITY Act
- Circle Stock Price Climbs 15% to $96, Can Rally Continue in March 2026?
- Bitcoin Price Prediction as US-Iran War Enters 4th Consecutive Day
- Top 5 Historical Reasons Dogecoin Price Is Not Rising


