Safety Net or Fragile Barrier? XRP Price takes Support at $0.5


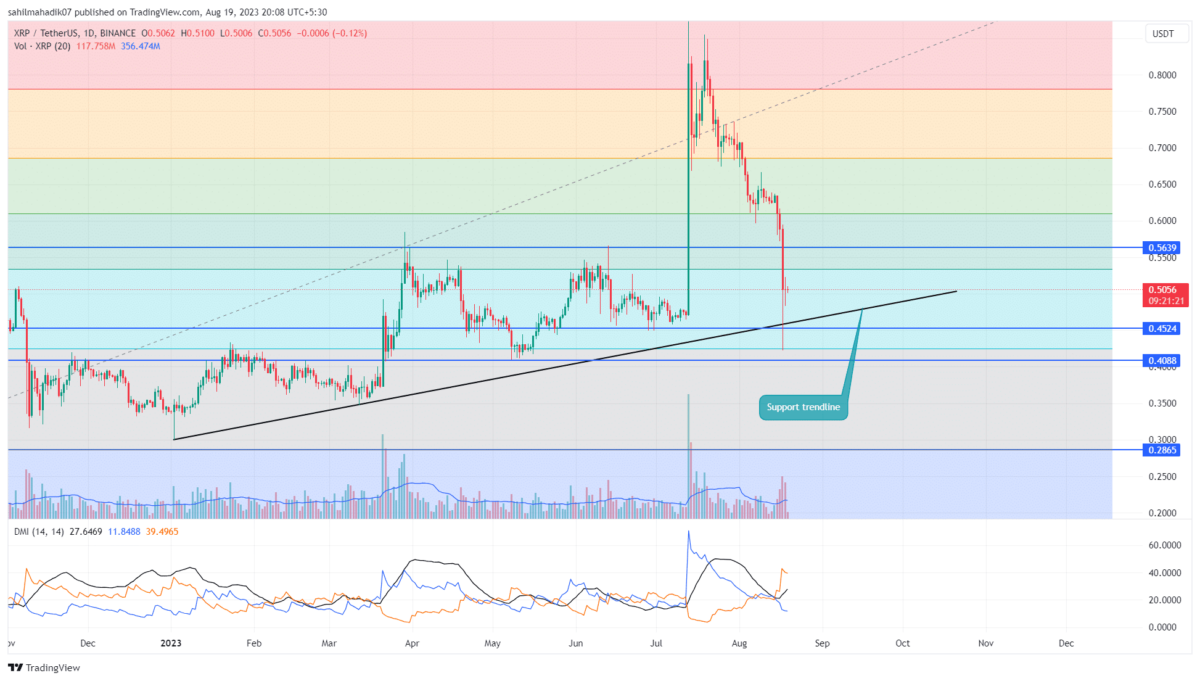
In response to the increasing bearish momentum in the crypto market, the XRP price has witnessed aggressive correction for over a month. From the last swing top of $0.938, the coin price plummets 46.4% to reach the current trading price of the $0.504 mark. Amid this downfall, the coin price has recently breached the $0.563 support providing sellers an additional barrier to offset buyers’ attempt to recover lost ground. Should you short XRP?
Also Read: XRP Price Bloodbath Hits 20% to $0.42, Deal or Trap?
XRP Daily Chart: Key Points
- A breakdown below the $0.56 support bolsters an 18% drop
- A seven-month-long support trendline could provide buyers XRP buyers an opportunity to counterattack
- The intraday trading volume in the XRP is $1.1 Billion, indicating a 64% gain.
 Source: Tradingview`
On August 17th, the crypto market experienced a sharp sell-off leading to extended correction in the majority of major digital coins. As a result, the XRP coin slipped 14% and breached $0.563 and 61.8% Fibonacci retracement level.
A high momentum breakdown reflects the seller’s conviction to plunge this altcoin price to lower levels. Currently, the XRP price trades at $0.50 trying to stabilize from the recent drop.
This struggle for sustainability below the breached support could trigger a minor consolidation below $0.56. Therefore, the coin holders can expect a sideway action in the coming days below the continuation of the downward trend.
Continuing with the bearish outlook, this breakdown could lead this fifth-largest cryptocurrency to $0.4 psychological support accounting for an 18% drop.
[converter id=”xrp-xrp” url=”https://coingape.com/price/converter/xrp-to-usd/?amount=1″]
Will XRP Buyers Make a Comeback?
A closer look at the daily time frame chart shows the August 17th fall in XRP price witnessed demand pressure at a long-coming support trendline near $0.5. The candle pattern shows a long-tail rejection indicating a counterattack from buyers. This surge in buying pressure could bolster the above-mentioned price consolidation and validate sustainability at a lower price. A breakdown below the trendline will signal a downtrend continuation.
- Fibonacci Retracement Level: A breakdown below 61.8% FIB level is a sign of weakness for the prevailing uptrend
- Directional Movement Index: A negative crossover state between the DI+(blue) and DI-(orange) slope reflects a sustained bear trend for XRP coins.

Why Trust CoinGape
CoinGape has covered the cryptocurrency industry since 2017, aiming to provide informative insights Read more…to our readers. Our journal analysts bring years of experience in market analysis and blockchain technology to ensure factual accuracy and balanced reporting. By following our Editorial Policy, our writers verify every source, fact-check each story, rely on reputable sources, and attribute quotes and media correctly. We also follow a rigorous Review Methodology when evaluating exchanges and tools. From emerging blockchain projects and coin launches to industry events and technical developments, we cover all facets of the digital asset space with unwavering commitment to timely, relevant information.

Related Articles


- Bitcoin vs Gold Feb 2026: Which Asset Could Spike Next?
- Top 3 Reasons Why Crypto Market is Down Today (Feb. 22)
- Michael Saylor Hints at Another Strategy BTC Buy as Bitcoin Drops Below $68K
- Expert Says Bitcoin Now in ‘Stage 4’ Bear Market Phase, Warns BTC May Hit 35K to 45K Zone
- Bitcoin Price Today As Bulls Defend $65K–$66K Zone Amid Geopolitics and Tariffs Tensions
- COIN Stock Price Prediction: Will Coinbase Crash or Rally in Feb 2026?
- Shiba Inu Price Feb 2026: Will SHIB Rise Soon?
- Pi Network Price Prediction: How High Can Pi Coin Go?
- Dogecoin Price Prediction Feb 2026: Will DOGE Break $0.20 This month?
- XRP Price Prediction As SBI Introduces Tokenized Bonds With Crypto Rewards
- Ethereum Price Rises After SCOTUS Ruling: Here’s Why a Drop to $1,500 is Possible


