SAND Price Prediction: Defends $3.0 Below 200-EMA; Is Bounce Back On The Cards?


SAND price extends the previous session’s losses but trades in a very tight range. There is a tug of war between bulls and bears. However, the higher price action is supported by the rising volumes. Bulls remain hopeful near the vital support level.
- SAND price trades with modest losses on Monday.
- The price remains largely sideways with no clear directional bias.
- The formation of ‘Doji’ candlesticks indicates SAND price could bounce back toward $3.25.
SAND price remains pressured below 200-EMA
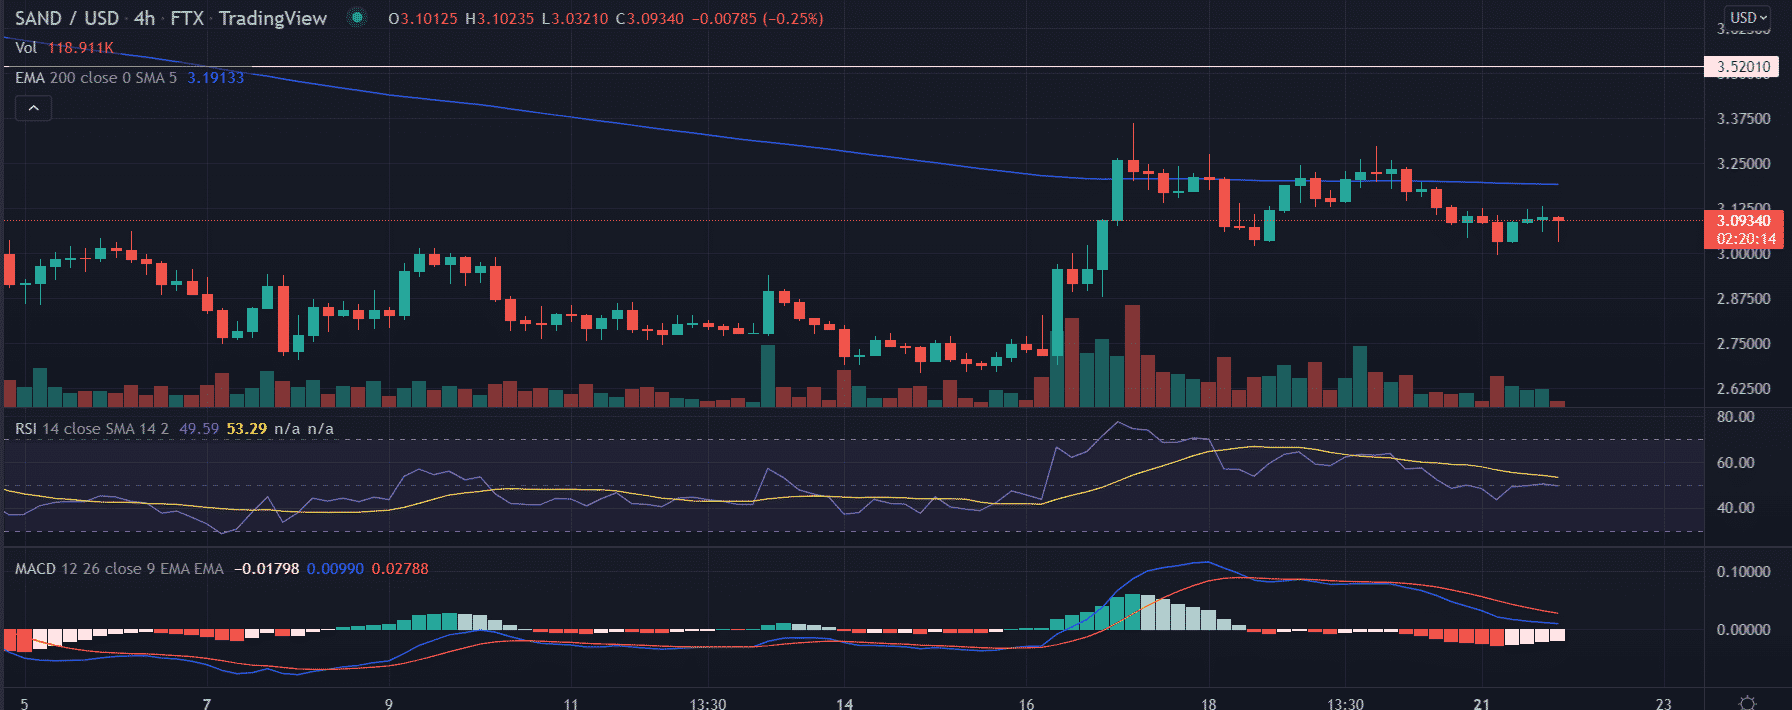
On the 4-hour chart, the SAND price is consolidating below the critical 200-EMA (Exponential Moving Average) at $3.19. However, sellers seem exhausted near the mentioned level as continued to consolidate since March 18. After retracing from the highs of $3.42, the pair hovered in a trading range of $2.60 and $3.0 for more than two weeks. The range was broken on March 16 and the asset tested the highs of $3.36 on the next day. However, bulls lacked the conviction to continue with the gains as the SAND price failed to sustain the momentum.
Looking at the current price action with the formation of the ‘Doji’ candlesticks near $3.0 suggests buyers seek some buying opportunities here. A strong buying pressure might cross the 200-day moving average and the SAND price could test $3.25 on an immediate basis.
Furthermore, an extended buying interest will bring the $3.50 horizontal resistance into play.
However, if the price is not able to sustain the session’s low under the influence of a renewed selling pressure then the SAND price will re-enter the consolidation phase before moving further south.
An interim support could be located near $2.75 on the 4-hour chart.
As of writing, SAND/USD is reading at $3.06, down 0.79% for the day. According to CoinMarketCap, the 24-hour trading volume holds at $544,442,184.
Technical indicators:
RSI: The Relative Strength Index remains negatively biased. It currently reads at 45.
MACD: The Moving Average Convergence Divergence approached the midline with a neutral bias.

Why Trust CoinGape
CoinGape has covered the cryptocurrency industry since 2017, aiming to provide informative insights Read more…to our readers. Our journal analysts bring years of experience in market analysis and blockchain technology to ensure factual accuracy and balanced reporting. By following our Editorial Policy, our writers verify every source, fact-check each story, rely on reputable sources, and attribute quotes and media correctly. We also follow a rigorous Review Methodology when evaluating exchanges and tools. From emerging blockchain projects and coin launches to industry events and technical developments, we cover all facets of the digital asset space with unwavering commitment to timely, relevant information.

Related Articles


- Bitcoin vs Gold Feb 2026: Which Asset Could Spike Next?
- Top 3 Reasons Why Crypto Market is Down Today (Feb. 22)
- Michael Saylor Hints at Another Strategy BTC Buy as Bitcoin Drops Below $68K
- Expert Says Bitcoin Now in ‘Stage 4’ Bear Market Phase, Warns BTC May Hit 35K to 45K Zone
- Bitcoin Price Today As Bulls Defend $65K–$66K Zone Amid Geopolitics and Tariffs Tensions
- COIN Stock Price Prediction: Will Coinbase Crash or Rally in Feb 2026?
- Shiba Inu Price Feb 2026: Will SHIB Rise Soon?
- Pi Network Price Prediction: How High Can Pi Coin Go?
- Dogecoin Price Prediction Feb 2026: Will DOGE Break $0.20 This month?
- XRP Price Prediction As SBI Introduces Tokenized Bonds With Crypto Rewards
- Ethereum Price Rises After SCOTUS Ruling: Here’s Why a Drop to $1,500 is Possible


