Sandbox Price Prediction: Is $SAND Price Ready to Reclaim $1?


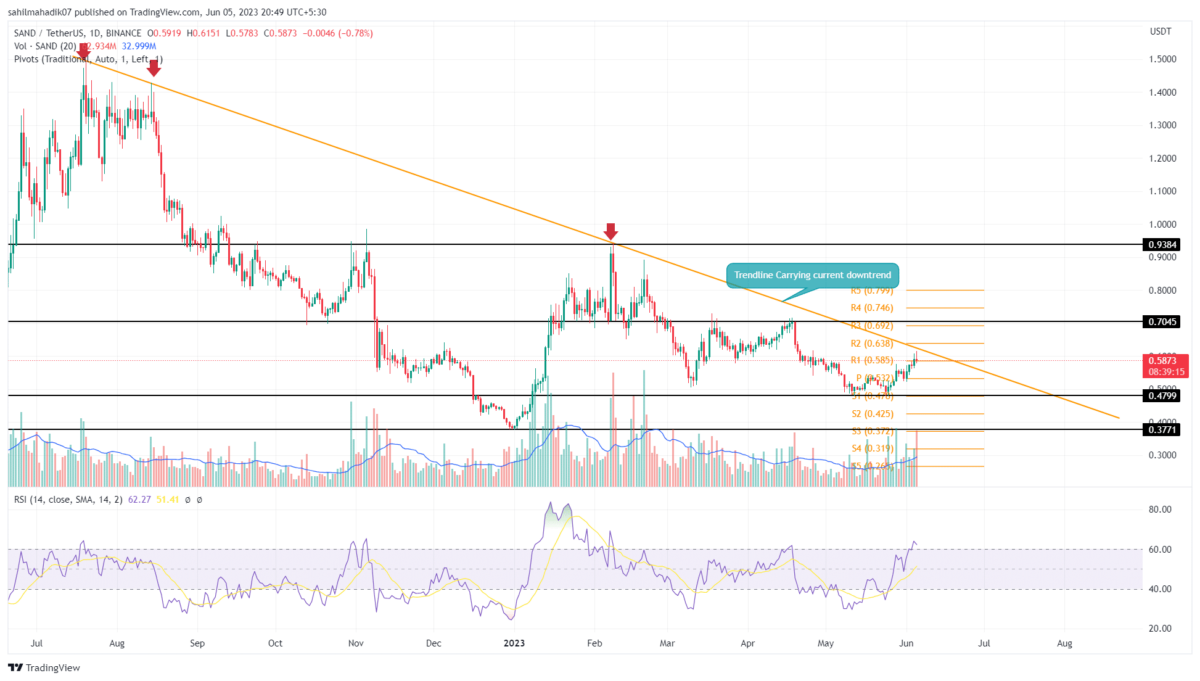
Sandbox Price Prediction: Defying the broader market sentiment of indecisiveness, the Sandbox coin price has showcased a significant recovery in the past two weeks. From the May month bottom of $0.47, the coin price surged 27.25% to reach the current price of $0.60. With sustained buying, the buyers will challenge a downsloping resistance trendline that carried a steady downtrend for the past eleven months. Can the SAND price break this crucial resistance?
Also Read: Will Metaverse Coins Make a Comeback In June 2023?; $MANA, $SAND, $AXS Price Analysis
Sandbox Price on the Daily Chart:
- The Sandbox price may prolong its ongoing trendline until the resistance trendline is intact.
- The downsloping 200-day EMA accentuates that the current market sentiment for SAND is bearish.
- The intraday trading volume in SAND price is $276.5 million, indicating a 275% gain.
 Tradingview
With an intraday gain of 3%, the rising Sandbox coin is about to hit an overhead resistance trendline. The coin price has already turned down thrice from the dynamic resistance, indicating that traders are actively selling at price rallies, which is one of the key traits of an established downtrend.
Therefore, in the coming days, the SAND price’s behavior at the aforementioned barrier will be crucial in determining the future trend. If the price shows strong rejection signs at the trendline, it would indicate that sellers continue to defend this level and may resume the prior downtrend.
The potential downtrend may plunge the price back to the $4.8 mark.
Conversely, traders looking for bullish opportunities must wait until the altcoin gives a decisive breakout with the daily candle closing above the falling trendline.
Will Sandbox Price Recover to $1?
The possibility of the SAND price reclaiming $1 and kicking off a bullish rally currently depends on the aforementioned trendline. The resistance governs the ongoing downtrend in the meta coin and could push the price lower until it is intact. Therefore, a potential bullish breakout from this formidable barrier will be a key sign of a trend reversal and may push the SAND price above $1.
- Relative Strength Index: The daily RSI slope above the 60% mark indicates that the bullish momentum is high, and buyers could make significant efforts to break the downsloping trendline.
- Pivot levels: This Support/Resistance determining indicator showcases that the SAND price may face heavy supply at $0.638 and $0.693, while it could witness suitable demand pressure at $0.587 and $0.534.

Why Trust CoinGape
CoinGape has covered the cryptocurrency industry since 2017, aiming to provide informative insights Read more…to our readers. Our journal analysts bring years of experience in market analysis and blockchain technology to ensure factual accuracy and balanced reporting. By following our Editorial Policy, our writers verify every source, fact-check each story, rely on reputable sources, and attribute quotes and media correctly. We also follow a rigorous Review Methodology when evaluating exchanges and tools. From emerging blockchain projects and coin launches to industry events and technical developments, we cover all facets of the digital asset space with unwavering commitment to timely, relevant information.

Related Articles


- Expert Says Bitcoin Now in ‘Stage 4’ Bear Market Phase, Warns BTC May Hit 35K to 45K Zone
- Bitcoin Price Today As Bulls Defend $65K–$66K Zone Amid Geopolitics and Tariffs Tensions
- XRP Realized Losses Spike to Highest Level Since 2022, Will Price Rally Again?
- Crypto Market Rises as U.S. and Iran Reach Key Agreement On Nuclear Talks
- Trump Tariffs: U.S. Raises Global Tariff Rate To 15% Following Supreme Court Ruling
- Shiba Inu Price Feb 2026: Will SHIB Rise Soon?
- Pi Network Price Prediction: How High Can Pi Coin Go?
- Dogecoin Price Prediction Feb 2026: Will DOGE Break $0.20 This month?
- XRP Price Prediction As SBI Introduces Tokenized Bonds With Crypto Rewards
- Ethereum Price Rises After SCOTUS Ruling: Here’s Why a Drop to $1,500 is Possible
- Will Pi Network Price See a Surge After the Mainnet Launch Anniversary?


