 Buy $GGs
Sandbox Price Prediction: Planning to Buy SAND Token? Price Faces 30% Downside Risk


Sandbox (SAND) price manages to reverse the previous two session’s low but with limited gains. The current price action suggests some consolidation before trending in a clear direction. Sandbox price faces strong resistance near $5.0.
- Sandbox price books modest gains on Friday.
- The price trades in the descending channel with a 30% downside risk.
- SAND slips below the 50-day Simple Moving Average at $4.73.
In a recent development, the Competition and Markets Authority (CMA) has announced a deal from Google to address competition concerns over the company’s Privacy Sandbox. Google is to seek out a way to replace third-party cookies with Privacy Sandbox.
Further, Gucci, the luxury fashion brand announced its official entry into metaverse by purchasing a virtual plot of land on the Sandbox.
SAND price set for a corrective pullback!
On the daily chart, the Sandbox (SAND) price has rallied more than 40% in the previous five sessions. The price rose from the lows made in January at $2.56. After last month’s bloodbath, the price hit the highs on February 7 after that altcoin has been consolidated near the same level.
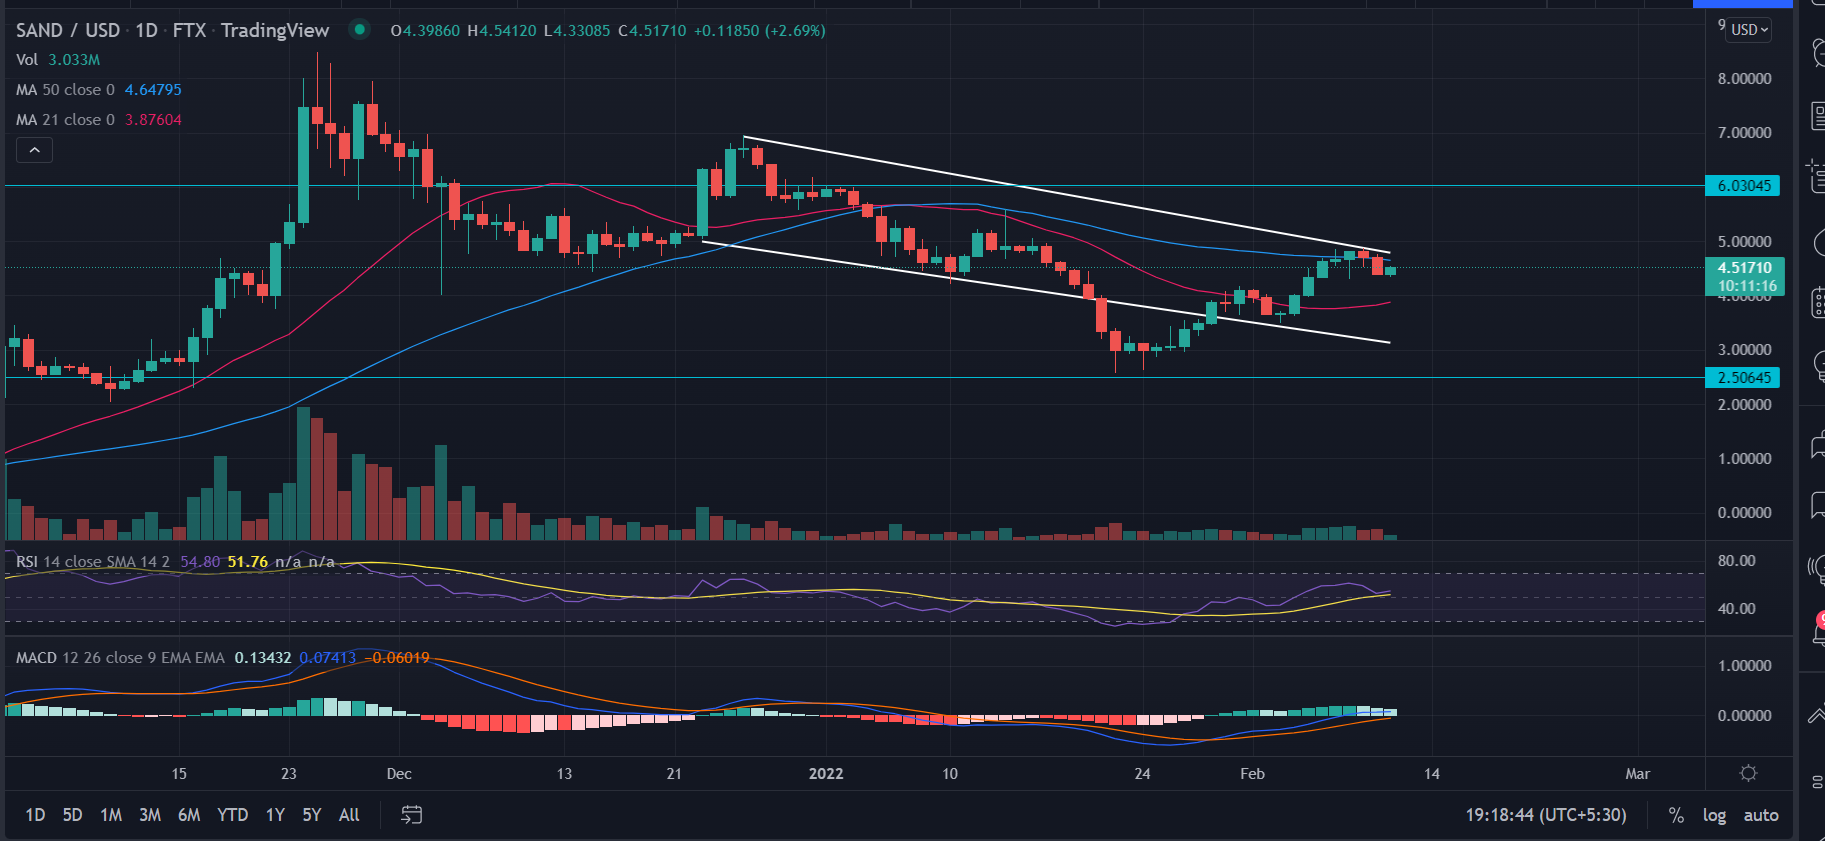
SAND price has been moving in a downside channel since December 26 with the classic lower high lower low formation. Bulls have taken control from the lows of $2.56, a resurgence of buyers around this level seems reasonable.
SAND price has crossed above the 21-day Simple Moving Average (SMA) but faces a double hurdle at the 50-day SMA and the bearish slopping line. A spike in descent price movement could trigger a fresh round of selling toward the lower trend line of the channel.
The immediate support is placed at a $2.50 horizontal support level, which also forms the double support formation.
On the other hand, a bullish breakout of the downside channel could push investors to take out the psychological $6.0 level.
Technical indicators:
RSI: The Relative Strength Index (RSI) trades at 50 just above the moving average line.
MACD: The Moving Average Convergence Divergence (MACD) just breached the midline with a bullish crossover.
Play 10,000+ Casino Games at BC Game with Ease
- Instant Deposits And Withdrawals
- Crypto Casino And Sports Betting
- Exclusive Bonuses And Rewards


Why Trust CoinGape
CoinGape has covered the cryptocurrency industry since 2017, aiming to provide informative insights Read more…to our readers. Our journal analysts bring years of experience in market analysis and blockchain technology to ensure factual accuracy and balanced reporting. By following our Editorial Policy, our writers verify every source, fact-check each story, rely on reputable sources, and attribute quotes and media correctly. We also follow a rigorous Review Methodology when evaluating exchanges and tools. From emerging blockchain projects and coin launches to industry events and technical developments, we cover all facets of the digital asset space with unwavering commitment to timely, relevant information.

Related Articles


- Breaking: Morgan Stanley Applies For Crypto-Focused National Trust Bank With OCC
- Ripple Could Gain Access to U.S. Banking System as OCC Expands Trust Bank Services
- $2T Barclays Explores Blockchain For Stablecoin Payments and Tokenized Deposits
- Breaking: U.S. PPI Inflation Rises To 2.9%, BTC Price Falls
- XRP News: Ripple-Backed Ctrl Alt Completes $280M in Diamond Tokenization on XRPL
- Top Analyst Predicts Pi Network Price Bottom, Flags Key Catalysts
- Will Ethereum Price Hold $1,900 Level After Five Weeks of $563M ETF Selling?
- Top 2 Price Predictions Ethereum and Solana Ahead of March 1 Clarity Act Stablecoin Deadline
- Pi Network Price Prediction Ahead of Protocol Upgrades Deadline on March 1
- XRP Price Outlook As Jane Street Lawsuit Sparks Shift in Morning Sell-Off Trend
- Dogecoin, Cardano, and Chainlink Price Prediction As Crypto Market Rebounds


