SHIB Price Analysis: Can $0.000007 Support Withstand Market Correction?


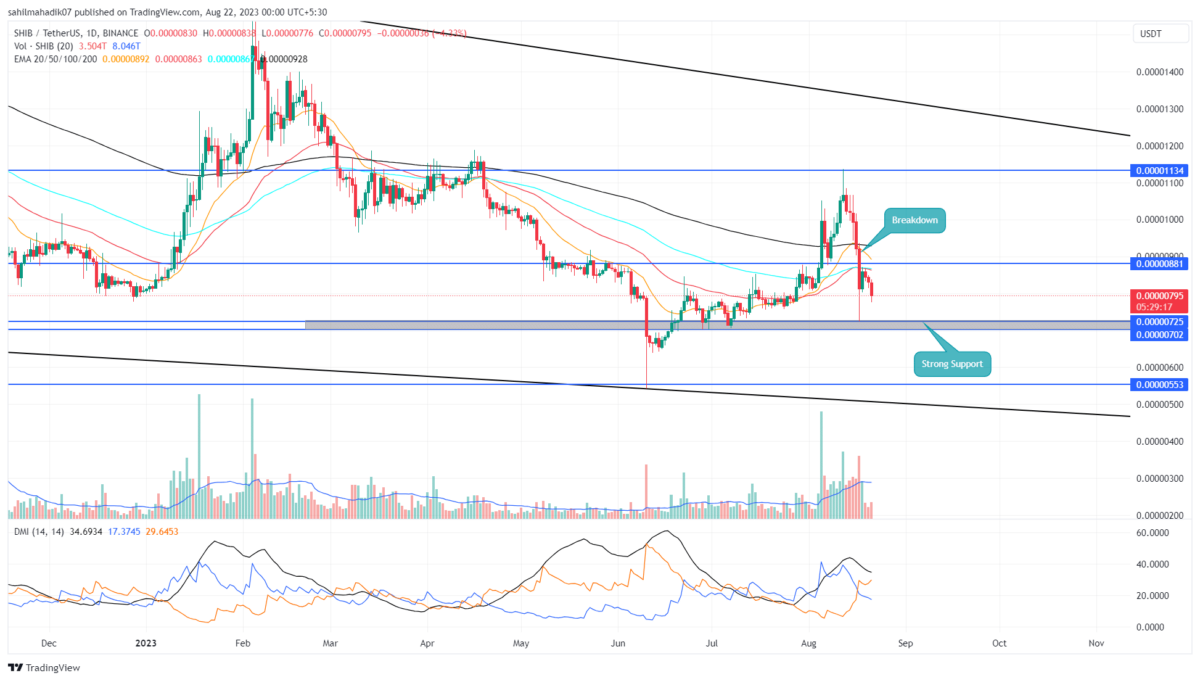
In response to rising bearishness in the crypto market, the Shiba Inu coin witnessed a sharp V-top reversal from $0.00001136. This type of reversal with significant volume growth indicates a sustained downfall from sellers. This falling price is gradually approaching another crucial support with a breakdown motive, indicating the popular memecoin may extend the correction trend.
Also Read: Whales Buying Shiba Inu Amid Shibarium Restart, SHIB Price To Rally?
Shiba Inu Daily Chart: Key Points
- A bearish breakdown from $0.000007 could assist sellers in a 20% fall.
- A coin price below daily EMA(20, 50, 100, and 200) accentuates a bearish trend sentiment
- The intraday trading volume of the Shiba Inu coin is $175.8 Million, showing a 14% gain.
 Source- Tradingview
On August 17th, the SHIB price gave a massive breakdown from the $0.0000088 support. Followed by a minor retest to confirm price sustainability at a lower level, the coin price continues its downward trend and is currently trading at $0.00000789.
The coin price falling for three consecutive days registers a 9% drop. If the bearish momentum rises, this memecoin may slip another 10% to challenge the $0.000007 psychological support.
A potential breakdown below it with daily candle closing will intensify the selling momentum and may prolong the downfall to a lower trendline of the channel pattern around $0.000005. This bottom trend could recuperate the bullish momentum and bolster a bullish reversal.
Can SHIB Price Hold $0.000007 Support?
A long-tail rejection candle attached to the August 17th candle indicates the high demand pressure at $0.000007. Therefore, the coin holders must keep a close watch on support as it could significantly influence the future movement. If the buying momentum persists at the aforementioned level, the SHIB price could witness a sideways rise in the near future.
- Exponential Moving Average: A bearish crossover between the 50-and-100-day EMA offers an additional edge to short sellers.
- Directional Movement Index: A bearish crossover state between the DI+(blue) and DI-(orange) indicates an aggressive bear trend.

Why Trust CoinGape
CoinGape has covered the cryptocurrency industry since 2017, aiming to provide informative insights Read more…to our readers. Our journal analysts bring years of experience in market analysis and blockchain technology to ensure factual accuracy and balanced reporting. By following our Editorial Policy, our writers verify every source, fact-check each story, rely on reputable sources, and attribute quotes and media correctly. We also follow a rigorous Review Methodology when evaluating exchanges and tools. From emerging blockchain projects and coin launches to industry events and technical developments, we cover all facets of the digital asset space with unwavering commitment to timely, relevant information.