SHIB Price Analysis: What Next After 25% Jump Shiba Inu?


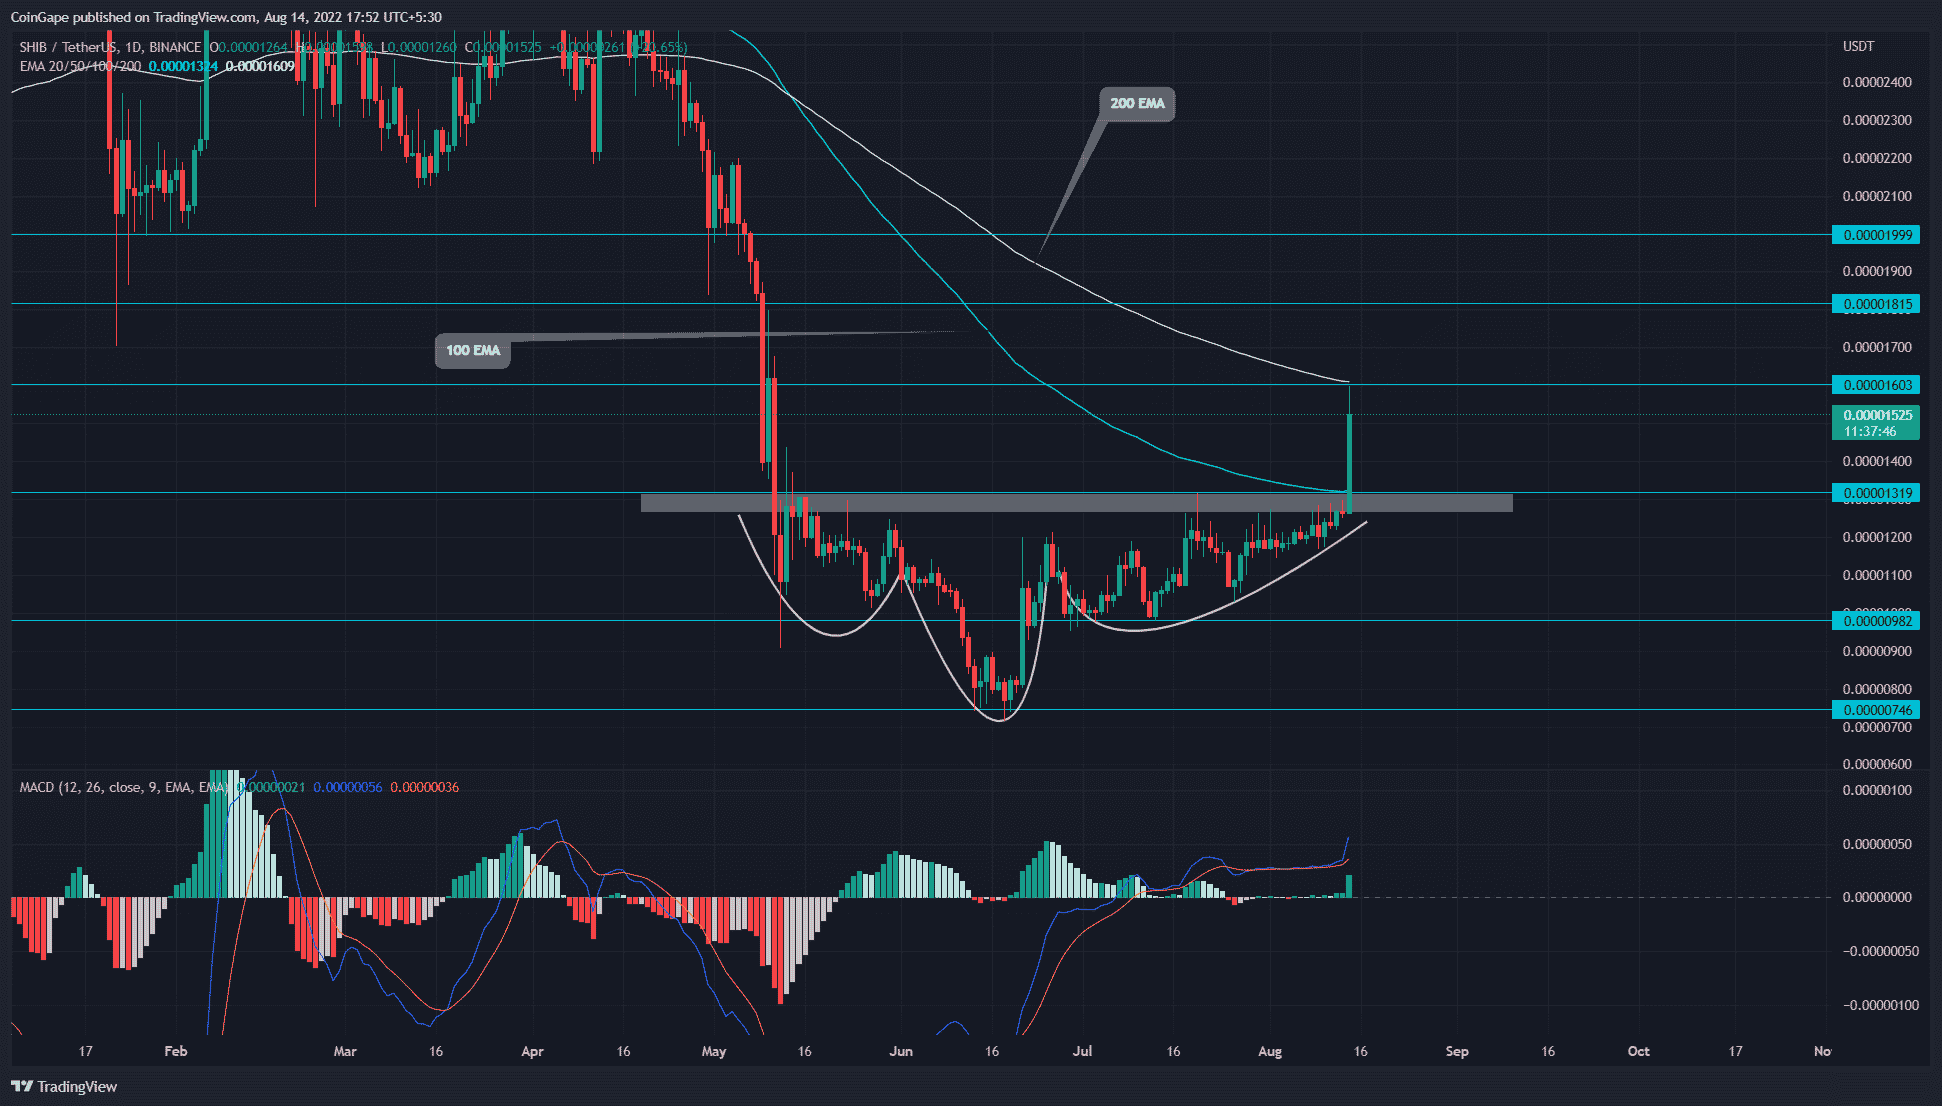
While several cryptocurrencies showed phenomenal growth in the past three months, the SHIB/USDT pair struggled to surpass the $0.000132 supply zone. However, the consolidation phase below the resistance level mentioned above revealed the formation of an inverted head and shoulder pattern.
Key points:
- The SHIB market value has soared 22.27% since last month
- The recent spike in market price tests the 200-day EMA
- The intraday trading volume of the Shiba Inu coin is $1.69 Billion, indicating a 350% gain.
 Source- Tradingview
After completing the right shoulder portion of this pattern which found proper support at the $0.00001 level, the SHIB price reached the neckline resistance of $0.000132. However, for nearly a month, the price action showed multiple high-wick rejection candles, indicating that sellers are aggressively defending this barrier.
Today, the SHIB price witnessed a significant inflow which surged the market value by 20%. This sudden price may be bounded by the recent tweet from @shib_superstore, that this month’s burn activity will surpass last month (July).
August 11
We passed $1000 for the month and just about the halfway point of last month, we are on pace to beat last month which is awesome!
Another milestone, we have passed $60,000 in total burn revenue!
Visit https://t.co/d0goxr6sys to see all the ways to burn through me. pic.twitter.com/JdL0D64RgW
— SHIB Super Store (@shib_superstore) August 12, 2022
Furthermore, this bullish growth has triggered the reversal pattern, which may bolster the buyers for further price recovery. However, earlier today, the SHIB price tagged the combined resistance of $0.000016 and 200-day EMA.
However, the coin price currently trading $0.00001525 mark indicates a higher price rejection attached to the daily candles. This reversal suggests profit booking from short-term traders. If the selling pressure persists, the coin price may plunge to the $0.000132 breached resistance.
This minor replacement will allow sideline buyers to enter at the retest point. With replenished bullish momentum, the post-retest rally should surge 45% higher to hit the $0.000019 psychological level.
Conversely, if the buyers fail to sustain about the $0.00132 flipped to support, the bullish thesis will get invalidated.
Technical indicator
MACD indicator: the MACD and signal lines gain a bullish spread with a spike in buying pressure evident by the boom in positive histograms. Furthermore, the lines sustain within the positive territory reflecting solid underlying bullishness.
EMA– The bullish candle tests the 200-day EMA and displays a higher price rejection that may shortly take support at the broken 100-day EMA.
- Resistance level: $0.000013 and $0.000017
- Support levels: $0.00000121 and $0.0000099

Why Trust CoinGape
CoinGape has covered the cryptocurrency industry since 2017, aiming to provide informative insights Read more…to our readers. Our journal analysts bring years of experience in market analysis and blockchain technology to ensure factual accuracy and balanced reporting. By following our Editorial Policy, our writers verify every source, fact-check each story, rely on reputable sources, and attribute quotes and media correctly. We also follow a rigorous Review Methodology when evaluating exchanges and tools. From emerging blockchain projects and coin launches to industry events and technical developments, we cover all facets of the digital asset space with unwavering commitment to timely, relevant information.

Related Articles


- Tom Lee’s Bitmine Doubles Down on Ethereum With $34.7M Fresh Purchase
- BlackRock Buys $65M in Bitcoin as U.S. Crypto Bill Odds Passage Surge
- Bitcoin Sell-Off Ahead? Garett Jin Moves $760M BTC to Binance Amid Trump’s New Tariffs
- CLARITY Act: Trump’s Crypto Adviser Says Stablecoin Yield Deal Is “Close” as March 1 Deadline Looms
- Trump Tariffs: U.S. To Impose 10% Global Tariff Following Supreme Court Ruling
- Ethereum Price Rises After SCOTUS Ruling: Here’s Why a Drop to $1,500 is Possible
- Will Pi Network Price See a Surge After the Mainnet Launch Anniversary?
- Bitcoin and XRP Price Prediction As White House Sets March 1st Deadline to Advance Clarity Act
- Top 3 Price Predictions Feb 2026 for Solana, Bitcoin, Pi Network as Odds of Trump Attacking Iran Rise
- Cardano Price Prediction Feb 2026 as Coinbase Accepts ADA as Loan Collateral
- Ripple Prediction: Will Arizona XRP Reserve Boost Price?


