 Buy $GGs
SHIB Price Prediction: Will Shiba Inu Coin Retest $0.000007 this Week?


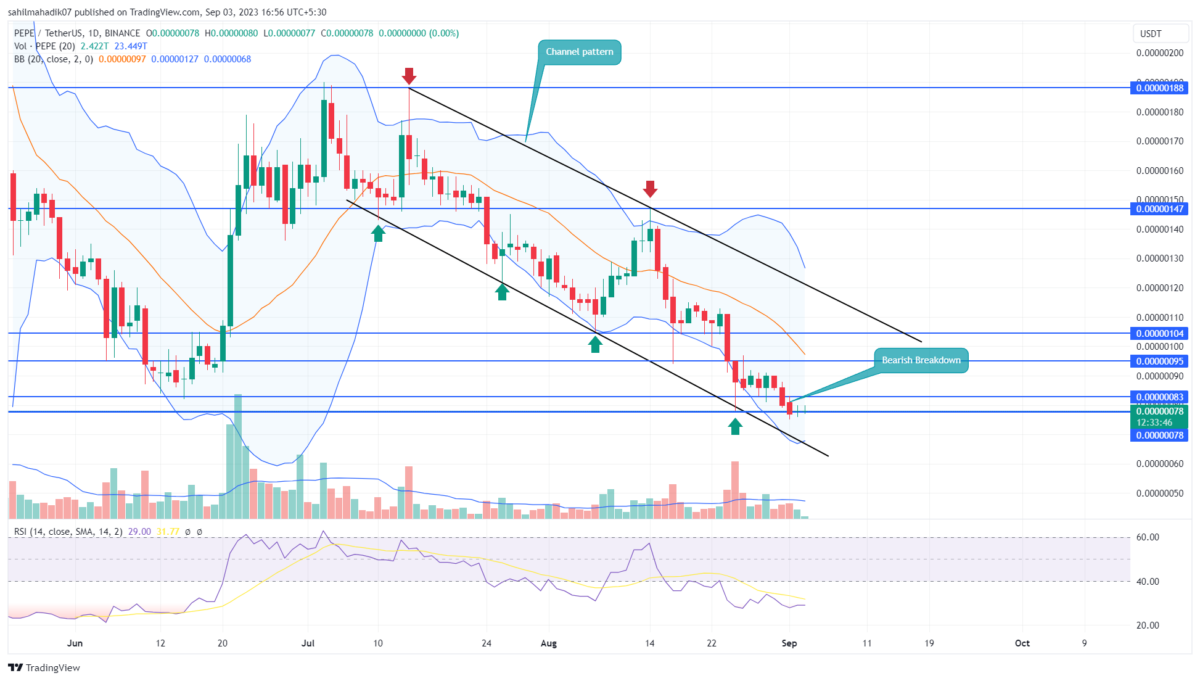
Amid the increasing selling pressure in the crypto market, the Shiba Inu has been in a falling trajectory since last week. From the last swing high of $0.0000086, the meme coin’s mark value dropped 9.55% to currently trade at $0.00000769. This downfall made a decisive breakdown from the support trendline of the bearish pattern indicating the SHIB price is at risk of further downfall.
Also Read: Whale Again Moves Massive 4.6 Trillion Shiba Inu (SHIB), Recovery Ahead?
Bearish Pennant Set SHIB Price Fall to $0.000007
- The Shiba Inu price has been falling for seven consecutive days
- Completion of bearish pennant pattern bolsters seller to challenge the $0.000007 psychological support
- The intraday trading volume of the Shiba Inu coin is $88 Million, showing a 13% gain.
 Source- Tradingview
On August 31st, the SHIB price gave a bearish breakout from the inverted pennant pattern, releasing the selling momentum built during the consolidation phase. The bearish breakdown followed by red candles in the daily chart indicates the sellers are likely to extend the current downfall.
With sustained selling the popular memecoin could tumble 6% to retest the immediate support of $0.0000075-$0.000007, followed by $0.0000055.
However, the falling price is associated with decreasing volume which showcases weakness in bearish momentum. As a result, the SHIB price may have witnessed increased demand pressure at $0.000007 to lead to a bullish reversal.
Here’s Why Shiba Inu Coin May Plunge to $0.000005
 Source- Tradingview
Taking a look at the bigger picture, the Shiba Inu coin weekly chart shows the ongoing downfall confided with two converging trendlines of a wedge pattern. In response to this chart pattern coin prices usually resonate within the falling trendlines until it gives breakout from either one. Considering a pessimistic approach, the ongoing downfall may extend to $0.000005 to meet the lower trendline of the pattern.
Anyhow, for memecoin holders to obtain a suitable signal for trend reversal, the buyers should break the upper trendline of the pattern.
- Exponential Moving Average: The coin price trading below the daily EMAs(20, 50, 100, and 200) indicates the overall downtrend.
- Relative Strength Index: The daily SHIB Price Prediction below 40% shows the sellers are gradually strengthening their over this memecoin
Play 10,000+ Casino Games at BC Game with Ease
- Instant Deposits And Withdrawals
- Crypto Casino And Sports Betting
- Exclusive Bonuses And Rewards


Why Trust CoinGape
CoinGape has covered the cryptocurrency industry since 2017, aiming to provide informative insights Read more…to our readers. Our journal analysts bring years of experience in market analysis and blockchain technology to ensure factual accuracy and balanced reporting. By following our Editorial Policy, our writers verify every source, fact-check each story, rely on reputable sources, and attribute quotes and media correctly. We also follow a rigorous Review Methodology when evaluating exchanges and tools. From emerging blockchain projects and coin launches to industry events and technical developments, we cover all facets of the digital asset space with unwavering commitment to timely, relevant information.

Related Articles


- Vitalik Buterin Maps Out Quantum Risks as Ethereum Foundation Unveils ‘Strawmap’
- BlackRock Adds $289M in BTC as Bitcoin ETFs Log 2-Week High Inflows Of $500M
- Glassnode Signals Bitcoin Still Faces Downside Risk Amid Massive Sell Pressure at $70K
- U.S House Introduces Bipartisan Crypto Bill To Protect Crypto Developers Amid DeFi Push Under CLARITY Act
- XRP News: Ripple Unveils Funding Hub To Support Innovation On XRPL
- Top 2 Price Predictions Ethereum and Solana Ahead of March 1 Clarity Act Stablecoin Deadline
- Pi Network Price Prediction Ahead of Protocol Upgrades Deadline on March 1
- XRP Price Outlook As Jane Street Lawsuit Sparks Shift in Morning Sell-Off Trend
- Dogecoin, Cardano, and Chainlink Price Prediction As Crypto Market Rebounds
- Will Solana Price Rally to $100 If Bitcoin Reclaims $72K?
- XRP Price Eye $2 Rebound as On-Chain Data Signals Massive Whale Accumulation


