 Buy $GGs
SHIB Price to Hit $0.00001? Triangle Pattern Points to Major Breakout


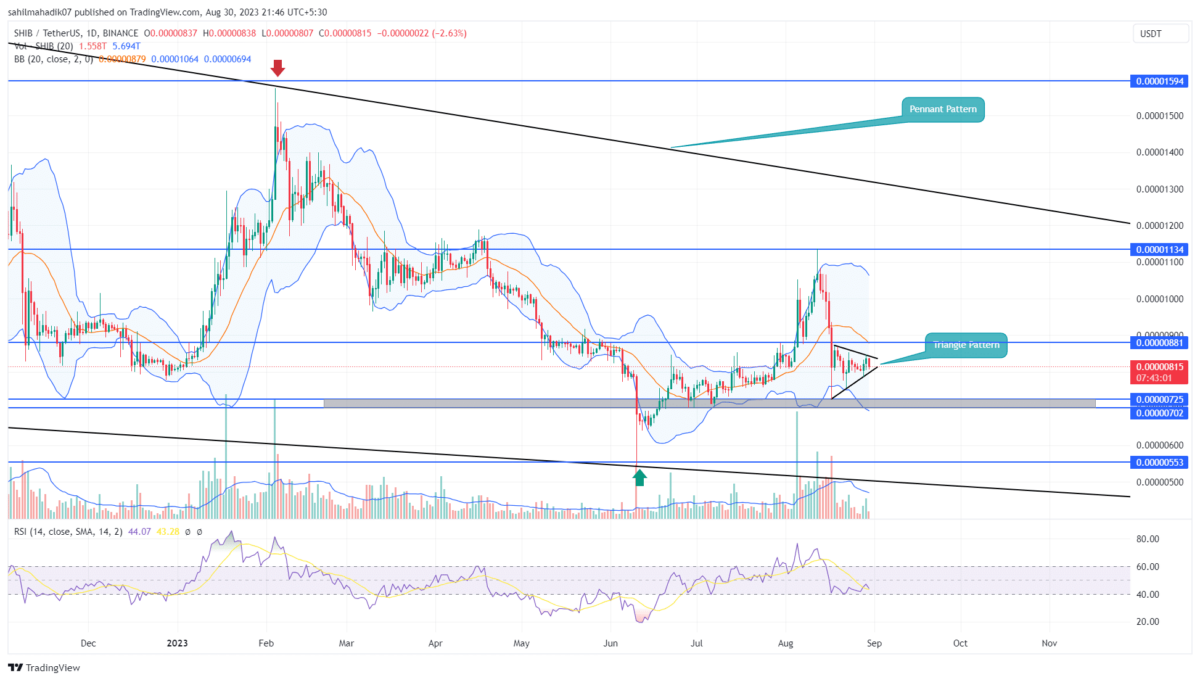
For the past two weeks, the Shiba Inu price has been trading sideways reflecting indecisive sentiment around the crypto space. However, the daily chart indicates this consolidation is confined within two converging trendlines indicating the formation of a symmetrical triangle pattern. With the coin price actively rebounding from the pattern’s converging trendline this setup should have a significant impact on near future trends.
Also Read: Memecoins Like Pepe Coin, DOGE, And Shiba Inu Outpace Stablecoins In Gas Fees
Shiba Inu Daily Chart: Key Points
- Overhead supply could prolong the sideways action in the SHIB price
- SHIB price edging close to the triangle peak hints that a breakout opportunity is near, suggesting a directional move ahead
- The intraday trading volume of the Shiba Inu coin is $175.8 Million, showing a 14% gain.
 Source- Tradingview
On August 29th, the crypto market witnessed a significant inflow in response to a sudden pump in Bitcoin price. As a result, this Dog-themed memecoin surged 2.8% and tried to break off its long-coming consolidation.
However, the buyers faced supply pressure near $0.00000845 and plunged back into the triangle pattern. Despite a push from the broader market and increasing volume, the SHIB price failure to surge higher reflects that buyers would need even higher momentum to escape the consolidation trend.
By the press time, the memecoin trades at $0.00000813, and with an intraday loss of 2.7% the price trend prolongs sideways. The potential traders must for this triangle breakout before entering a position in the market.
Can SHIB Price to Regain $0.00001?
While the triangle pattern supper trend continues, the Shib sellers have a higher possibility to break the lower trendline. A 4-hour candle closing below the support trendline will accelerate the selling pressure and push the price back to $0.000007 psychological support.
On a contrary note, an upside breakout from a triangle pattern could assist a price rally above the $0.0000088 barrier to hit $0.0000113.
- Bollinger Band: The lower boundary of the Bollinger Band indicator flattening at $0.000007 could offer additional support to coin buyers.
- Relative Strength Index: The daily RSI slope below the 50% midline indicates the bearish momentum in active.
Play 10,000+ Casino Games at BC Game with Ease
- Instant Deposits And Withdrawals
- Crypto Casino And Sports Betting
- Exclusive Bonuses And Rewards


Why Trust CoinGape
CoinGape has covered the cryptocurrency industry since 2017, aiming to provide informative insights Read more…to our readers. Our journal analysts bring years of experience in market analysis and blockchain technology to ensure factual accuracy and balanced reporting. By following our Editorial Policy, our writers verify every source, fact-check each story, rely on reputable sources, and attribute quotes and media correctly. We also follow a rigorous Review Methodology when evaluating exchanges and tools. From emerging blockchain projects and coin launches to industry events and technical developments, we cover all facets of the digital asset space with unwavering commitment to timely, relevant information.

Related Articles


- Bitwise CIO Calls Bitcoin Selloff ‘Classic Cycle,’ Dismisses Manipulation Rumors
- Cardone Capital Takes Real Estate On-Chain With $5B Tokenization Plan
- Senator Elizabeth Warren Targets Trump-Affiliated World Liberty Financial Over Bank Charter Bid
- JPMorgan Projects Bullish Crypto Market in H2 Following CLARITY Act Approval
- Hong Kong Moves Closer to Crypto Tax Cuts Amid Stablecoin Regulatory Framework
- Top 2 Price Predictions Ethereum and Solana Ahead of March 1 Clarity Act Stablecoin Deadline
- Pi Network Price Prediction Ahead of Protocol Upgrades Deadline on March 1
- XRP Price Outlook As Jane Street Lawsuit Sparks Shift in Morning Sell-Off Trend
- Dogecoin, Cardano, and Chainlink Price Prediction As Crypto Market Rebounds
- Will Solana Price Rally to $100 If Bitcoin Reclaims $72K?
- XRP Price Eye $2 Rebound as On-Chain Data Signals Massive Whale Accumulation


