Shiba Inu, Dogecoin Price Prediction- Here’s How You May Trade In Stagnant Market Condition


Shiba Inu, Dogecoin Price Prediction: the overall crypto market struggles in uncertainty as the BTC and Ethereum prices move sideways. As a result, the top Meme cryptocurrencies, Dogecoin and Shiba Inu coin have shown limited growth since last week. However, the technical chart revealed some trading setups that may provide entry opportunities for traders.
Market Leaders
The Bitcoin price currency trades at $16841 with an intraday gain of 0.07; meanwhile, the Ethereum price exchange hands at $1217, with an intraday loss of 0.08%.
Shiba Inu Coin
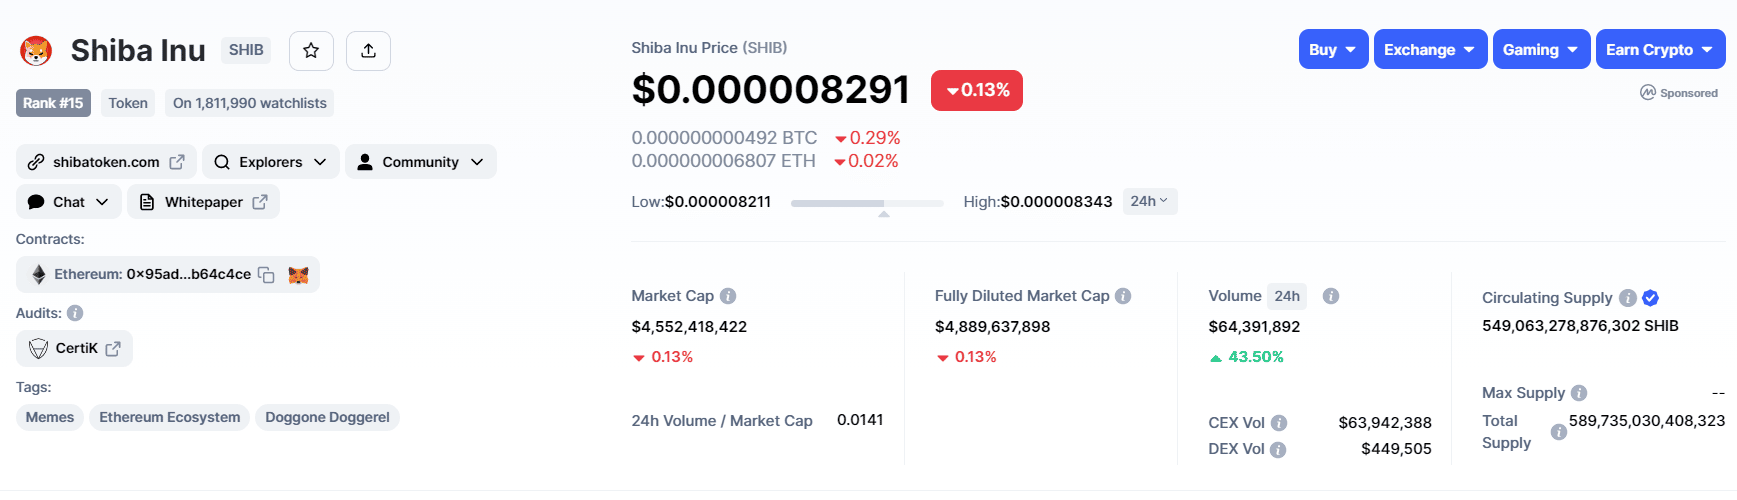 Source- Coinmarketcap
The Shiba Inu daily time frame chart shows the formation of a falling wedge pattern. This bullish continuation pattern offers a strong direction rally upon the break out of its resistance trendline.
Moreover, the prices had recently bounced back from the support trendline, which should ideally bolster buyers to challenge the overhead trendline. However, amid the ongoing uncertainty, the SHIB price has been sideways for more than a week.
 Source- Tradingview
Interestingly this short range represents a symmetrical triangle pattern in the four-hour chart. A breakout from this pattern’s resistance and will signal the end of the consolidation face.
This breakout may drive the Shiba Inu coin 5% higher to retest the wedge pattern trendline.
Conversely, a breakdown below the triangle pattern’s trendline may tumble the price 6% down to hit the lower trendline.
Having said that, the area inside the triangle pattern can be considered as no trading zone.
Dogecoin
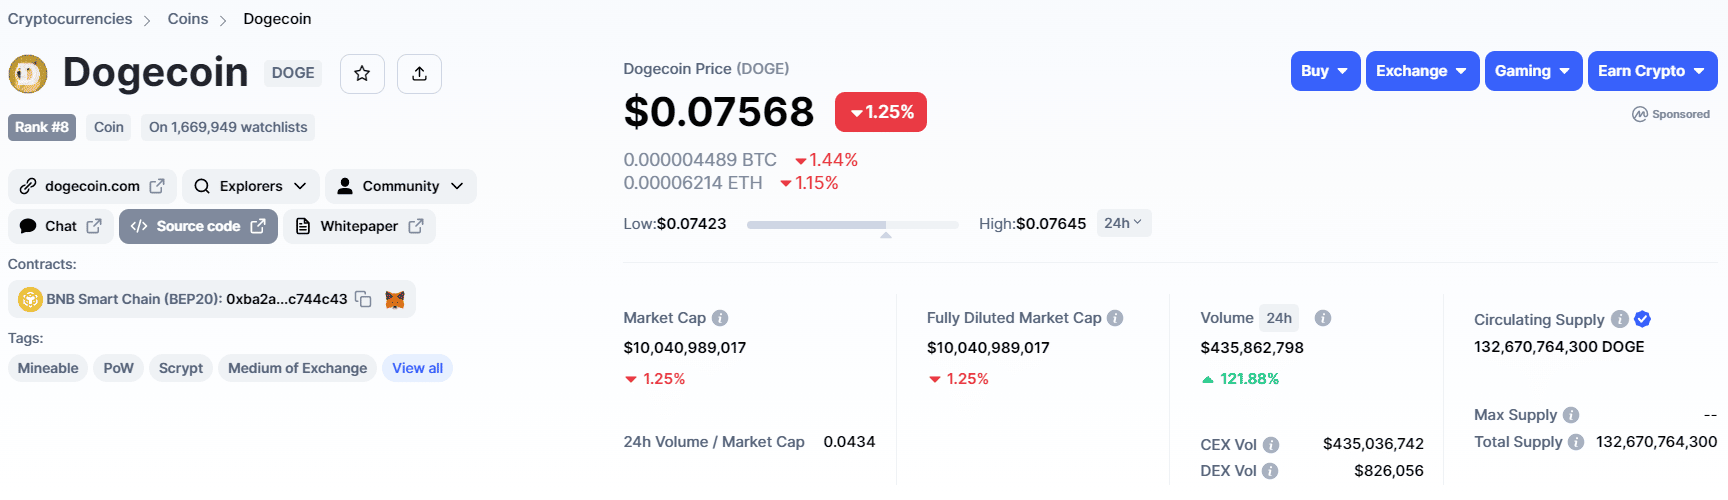 Source- Coinmarketcap
During the recent downfall in the market, the Dogecoin price plunged back to the local support of $0.07. Moreover, this price support has rebounded this memecoin twice, validating it as an active accumulation zone.
On December 20th, the DOGE price rebounded from $0.07 support and surged 11.5% higher to challenge the 0.078 resistance. However, with the current indecisiveness among the market participants, the coin price wavers within the mentioned levels and currently trades at $0.075.
 Source-Tradingview
Thus, a bullish breakout from the $0.078 resistance signals the replenished bullish momentum and may start a fresh recovery rally to challenge the $0.11 barrier.

Why Trust CoinGape
CoinGape has covered the cryptocurrency industry since 2017, aiming to provide informative insights Read more…to our readers. Our journal analysts bring years of experience in market analysis and blockchain technology to ensure factual accuracy and balanced reporting. By following our Editorial Policy, our writers verify every source, fact-check each story, rely on reputable sources, and attribute quotes and media correctly. We also follow a rigorous Review Methodology when evaluating exchanges and tools. From emerging blockchain projects and coin launches to industry events and technical developments, we cover all facets of the digital asset space with unwavering commitment to timely, relevant information.