 Claim Card
Shiba Inu Price Analysis: Can $SHIB Bulls Defend $0.00000572 Support Amid Market Sell-off?


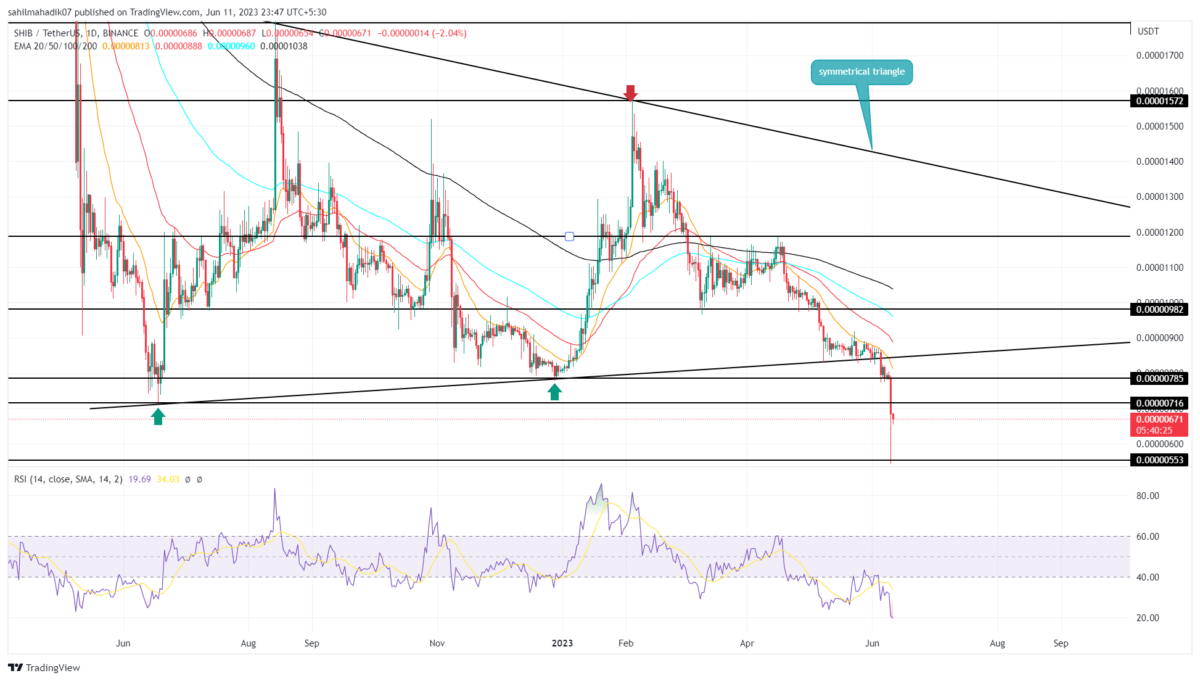
Shiba Inu Price Analysis: On June 5th, the SHIB price gave a decisive breakdown from the support trendline of a symmetrical triangle pattern. This breakdown resolved a one-year consolidation in the seller’s favor indicating this memecoin is poised for a significant downfall. The negative sentiment in the market also rooted for the same cause suggests this memecoin is less likely to make a sharp recovery in the near future.
Also Read: 4 Trillion SHIB Worth $32 Million Moved To Binance, Price To Fall?
Shiba Inu Price Daily Chart
- Demand pressure at $0.00000572 support could hint at a bullish reversal in the SHIB price.
- The daily RSI slope at the oversold region indicates that more buyers could enter at discounted prices.
- The intraday trading volume of the Shiba Inu coin is $120.5 Million, showing a 68% loss.
 Source- Tradingview
From the triangle breakdown point of $0.00000824, the Shiba Inu price tumbles 33% and reaches a two-year low of $0.00000543. However, on June 10th, the aggressive selling was immediately undermined by the buyers as they recovered the losses witnessed during the day.
The long tail rejection candle projected at $0.00000572 support indicated the buyers are accumulating at this discounted price which could lead to a minor pullback. As of now, the SHIB price trades at $0.0000066 with an intraday loss of 2.48%.
If the demand pressure from bottom support rises, the SHIB price could rise 17% to retest the breached $0.00000778 support as potential resistance.
After such a massive downfall, a sudden recovery is less possible, and therefore, the SHIB price could turn sideways above $0.00000572
Will Shiba Inu’s Price Lose $0.00000572?
Amid the sudden downfall, the SHIB price managed to sustain above the $0.00000572 level. Despite a strong bearish scenario, the coin price stayed above the aforementioned level indicating a breakdown below it would be very tough for sellers. Thus, the retest to the $0.00000572 support could be an opportunity to accumulate SHIB.
- Exponential Moving Average: The dynamic resistance of the 20-day EMA will be the first sign of bullish recovery if breached.
- Relative Strength Index: The daily RSI slope plunge into the oversold region also indicates unstable aggressive selling which could trigger a quick rebounce.

Why Trust CoinGape
CoinGape has covered the cryptocurrency industry since 2017, aiming to provide informative insights Read more…to our readers. Our journal analysts bring years of experience in market analysis and blockchain technology to ensure factual accuracy and balanced reporting. By following our Editorial Policy, our writers verify every source, fact-check each story, rely on reputable sources, and attribute quotes and media correctly. We also follow a rigorous Review Methodology when evaluating exchanges and tools. From emerging blockchain projects and coin launches to industry events and technical developments, we cover all facets of the digital asset space with unwavering commitment to timely, relevant information.

Related Articles


- Peter Schiff Casts Doubt on Bitcoin Rally Ahead of Trump’s SOTU Speech
- Putin Signs Law to Confiscate Bitcoin Amid Russia’s Crypto Crackdown, Pavel Durov Probe
- Michael Saylor’s Strategy Moves $83M in Bitcoin as $9B Paper Losses Raises Pressure
- Stripe Eyes PayPal Acquisition Amid Stablecoin Expansion
- Expert Predicts Deeper Bitcoin Decline as JPMorgan CEO Warns of Similarities to the 2008 Financial Crisis
- Cardano Price Signals Rebound as Whales Accumulate 819M ADA
- Sui Price Eyes Recovery as Third Spot SUI ETF Debuts on Nasdaq
- Pi Network Price Eyes a 30% Jump as Migrations Jumps to 16M
- Will Ethereum Price Dip to $1,500 as Vitalik Buterin Continues Selling ETH?
- XRP Price Outlook as Clarity Act Passage Odds Plunge to 53%
- COIN Stock Risks Crashing to $100 as Odds of US Striking Iran Jump


