 Buy $GGs
Shiba Inu Price Analysis: $SHIB Price Poised for Major Correction as Buyers Lose Crucial Support


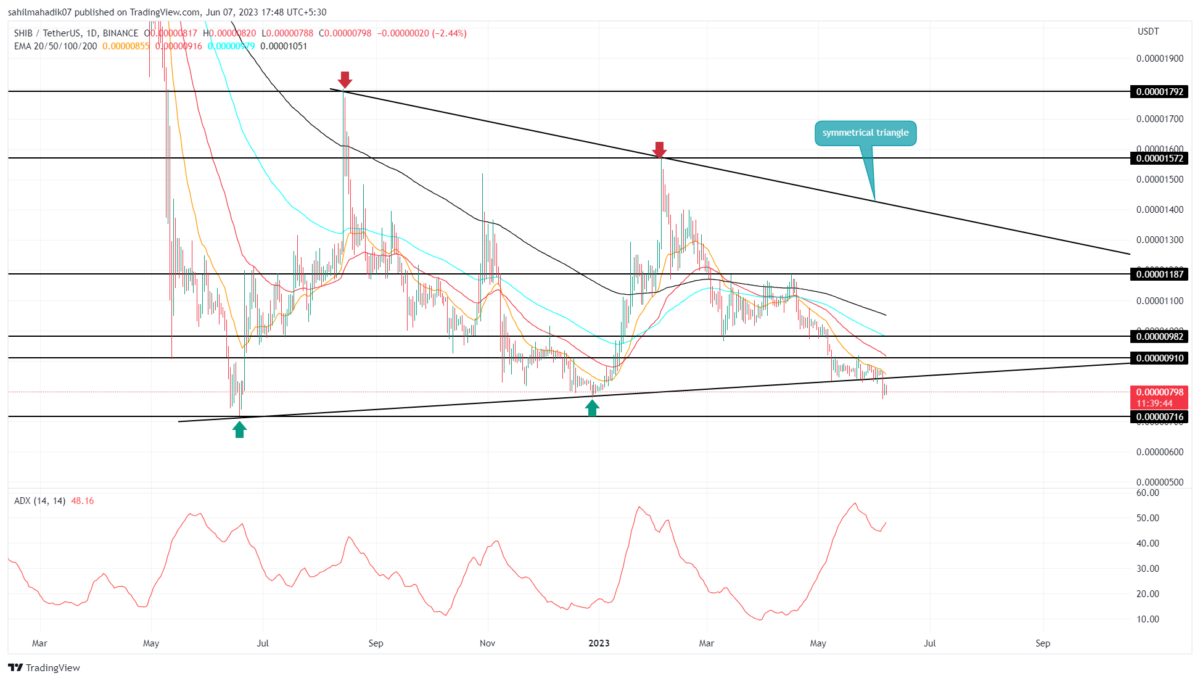
Shiba Inu Price Analysis: For over a year, the Shiba Inu price has been trading sideways resonating strictly between the two converging trendlines. In the weekly time frame chart, this consolidation reveals the formation of a famous continuation pattern called a symmetrical triangle. Amid the recent sell-off in the crypto market, the sellers breached the support trendline of the pattern indicating the SHIB price could continue the prior downtrend. Here’s how this pattern could influence this memecoin’s near future movement.
Also Read: Dormant Shiba Inu Whale Shifts 500 Billion SHIB; Dump Ahead?
Shiba Inu Price Daily Chart-
- A bearish breakdown from the support trendline offers a short-selling opportunity to interested traders
- If the price manages to break above the 20-day EMA dynamic resistance, it would indicate an early signal that contradicts the bearish thesis.
- The intraday trading volume of the Shiba Inu coin is $122,6 Million, showing an 18% loss.
 Source- Tradingview
On June 5th, the crypto market witnessed a significant sell-off and triggered a 7.5% intraday fall. The long-bearish candle gave a decisive breakdown below the support trendline of the triangle pattern.
The long-coming trendline has prevented the SHIB price from a massive downfall and provided buyers with a strong accumulation zone. Therefore, with the recent breakdown, the underlying selling pressure should accelerate the plunge of the coin price to the next significant support of $0.00000716.
If the Shiba Inu price rises back above the trendline in the coming week or two, the bearish thesis will get invalidated.
Will Shiba Inu’s Price Hit $0.00000716?
The Support trendline breakdown has set the Shiba Inu price for a significant downfall. However, the prices are yet to reflect their sustainability before confirmation of a short-sell opportunity. The coming two weeks could be important for SHIB holders to check whether prices hold lower levels or not. A potential breakdown will lead the coin to $0.00000716, and on the flip side, if the price enters the triangle pattern, the breakdown will be marked as a bear trap. long-coming.
- Average Directional Index: The ADX slope at 48% of the current price action is unstable and less likely to trigger a steady downfall right away.
- Exponential Moving Average: The downsloping EMAs(20, 50, 100, and 200) create multiple hurdles for buyers on the upside.
Play 10,000+ Casino Games at BC Game with Ease
- Instant Deposits And Withdrawals
- Crypto Casino And Sports Betting
- Exclusive Bonuses And Rewards


Why Trust CoinGape
CoinGape has covered the cryptocurrency industry since 2017, aiming to provide informative insights Read more…to our readers. Our journal analysts bring years of experience in market analysis and blockchain technology to ensure factual accuracy and balanced reporting. By following our Editorial Policy, our writers verify every source, fact-check each story, rely on reputable sources, and attribute quotes and media correctly. We also follow a rigorous Review Methodology when evaluating exchanges and tools. From emerging blockchain projects and coin launches to industry events and technical developments, we cover all facets of the digital asset space with unwavering commitment to timely, relevant information.


Related Articles


- Peter Schiff Predicts BTC to Fall, Gold to Rise as Markets Price in Prolonged Iran War
- Institutional Re-Accumulation Signs Emerge as Bitcoin ETFs See $1.1B Net Inflows Since Iran War Began: Glassnode
- From Mining Pool to Infrastructure Platform: Nine Years of EMCD
- U.S.-Iran War: U.S. Oil Prices Spike To One-Year High, Bitcoin and Gold Dip
- Crypto Traders Bet Against U.S.-Iran Ceasefire This Month as Iran Denies Peace Talks
- HOOD Stock Targets $100 as Robinhood Unveils Platinum Card and Advance Dividend Feature
- Bitcoin Price Prediction if Donald Trump Signs the CLARITY Act on April 3, 2026
- Pi Network Price As BTC Rallies Above $74K: Can PI Coin Extend Gains to $0.30?
- XRP Price As Bitcoin Reclaims $74K- Is $5 Next?
- Dogecoin Price Outlook as BTC Recovers Above $73,000
- XRP Price Prediction as Iran-U.S. Peace Talks Trigger a Crypto Rally


