 Buy $GGs
SHIB Price Analysis: Shiba Inu Forms An Inverted Pennant Pattern; Another 35% Dip On Charts


Since the correction phase initiated in October end of 2021, the SHIB price has only experienced a steady downtrend. The token price has tumbled by 75% from the All-Time High of $0.00008455, and current hints further sell-off respecting a falling channel pattern. However, the Shibarmy should be excited as Shiba Inu is prepared to launch its Metaverse-‘Shiberse’ in 2022.
Key technical points:
- The SHIB buyers lost the 200- MA support
- The intraday trading volume in the SHIB is $554.6 Billion, indicating a 17.9% fall.
Read More: Crypto Becomes Legal In India, Here’s All You Need to Know
 Source- Tradingview
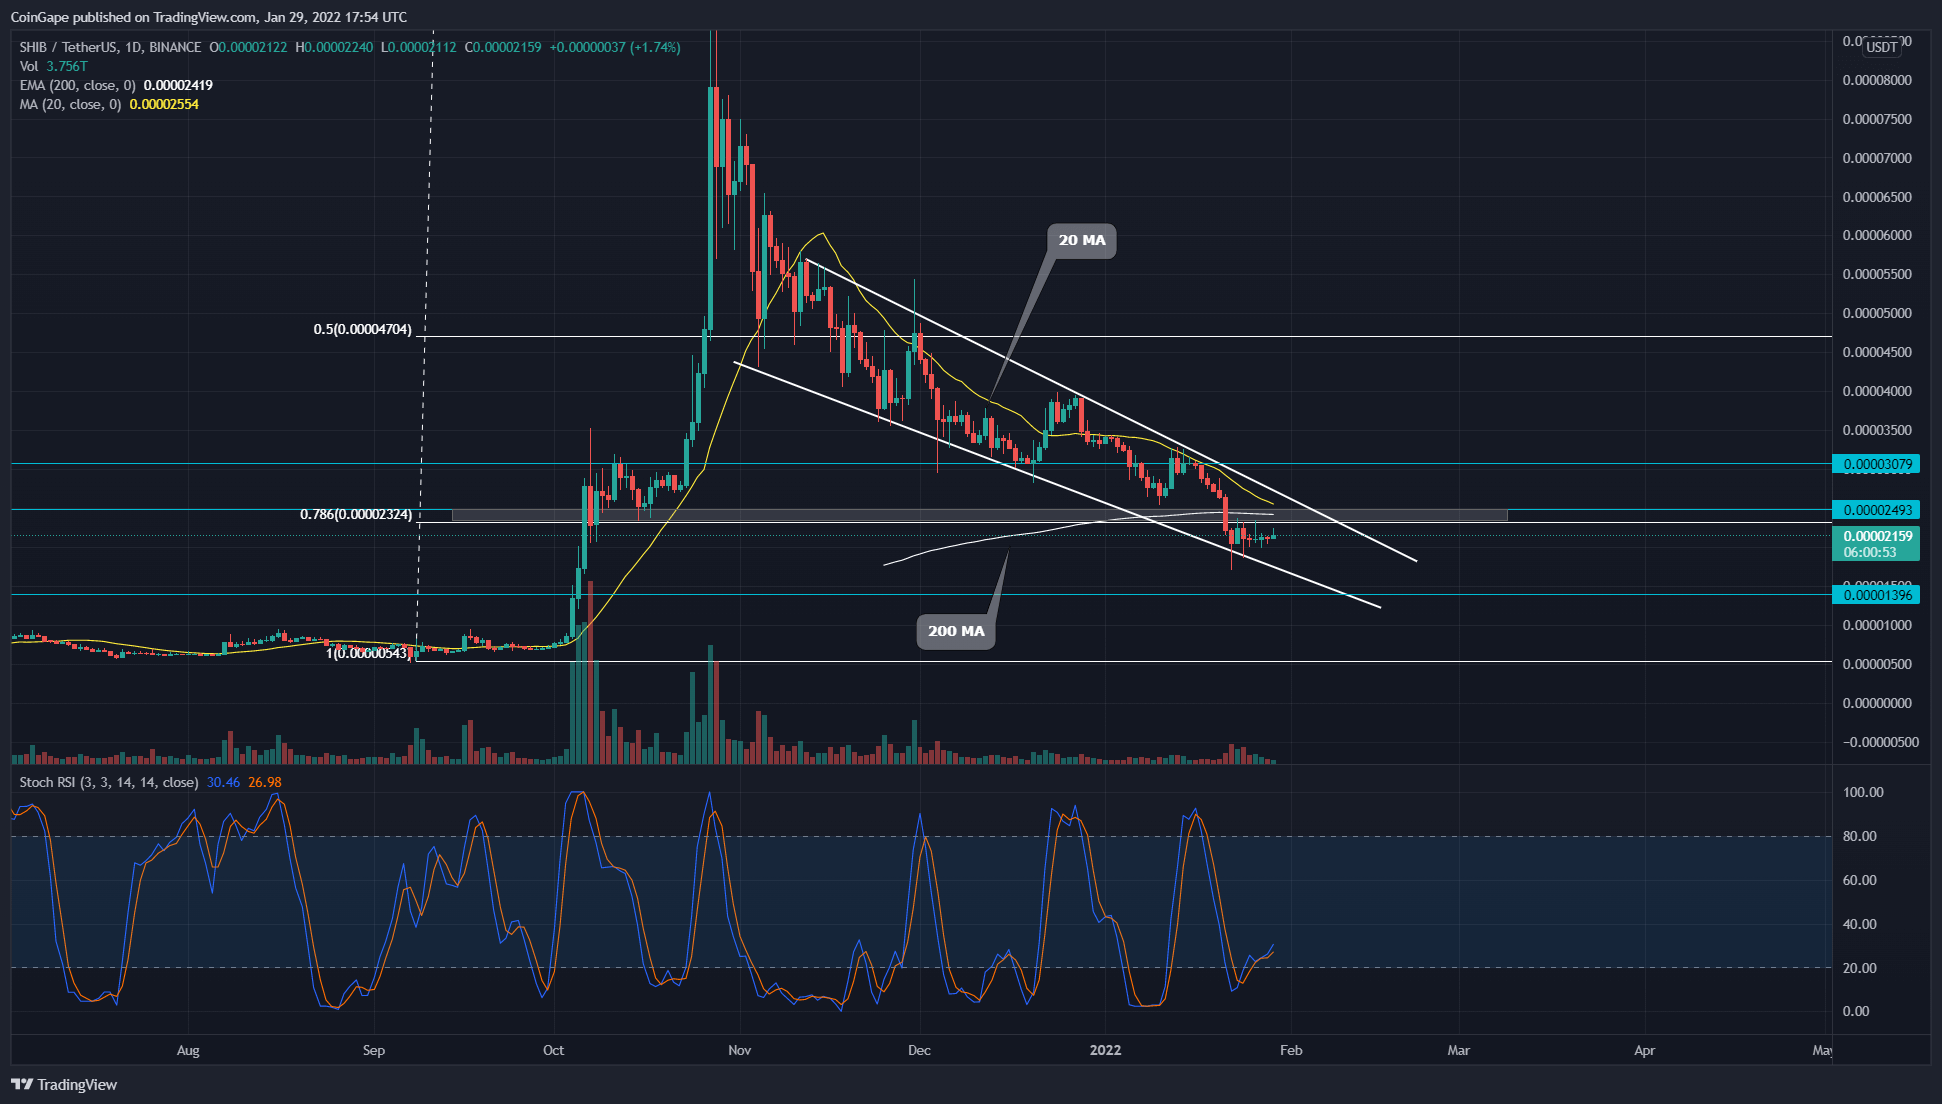
As mentioned in our previous Shiba Inu price analysis, the SHIB buyers lost a crucial shared support level of 0.786 Fibonacci retracement level and 200-day MA on January 21st. With this breakdown, the token price was expected to plunge to the $0.000014 support after retesting the flipped resistance($0.000023) for sufficient supply.
- However, the descending trendline providing strong support to the SHIB price holds the coin just below the $0.000023 mark. This week the token chart shows several Doji candles, indicating uncertainty among the market participants.
- This recent free fall has engulfed the 200-day MA, indicating a bearish trend. Moreover, the 20 and 200-day is on the verge of giving a bearish crossover.
- The daily Stochastic RSI providing a bullish crossover among the K and D line struggles to rise higher, suggesting a lack of bullish momentum from bulls.
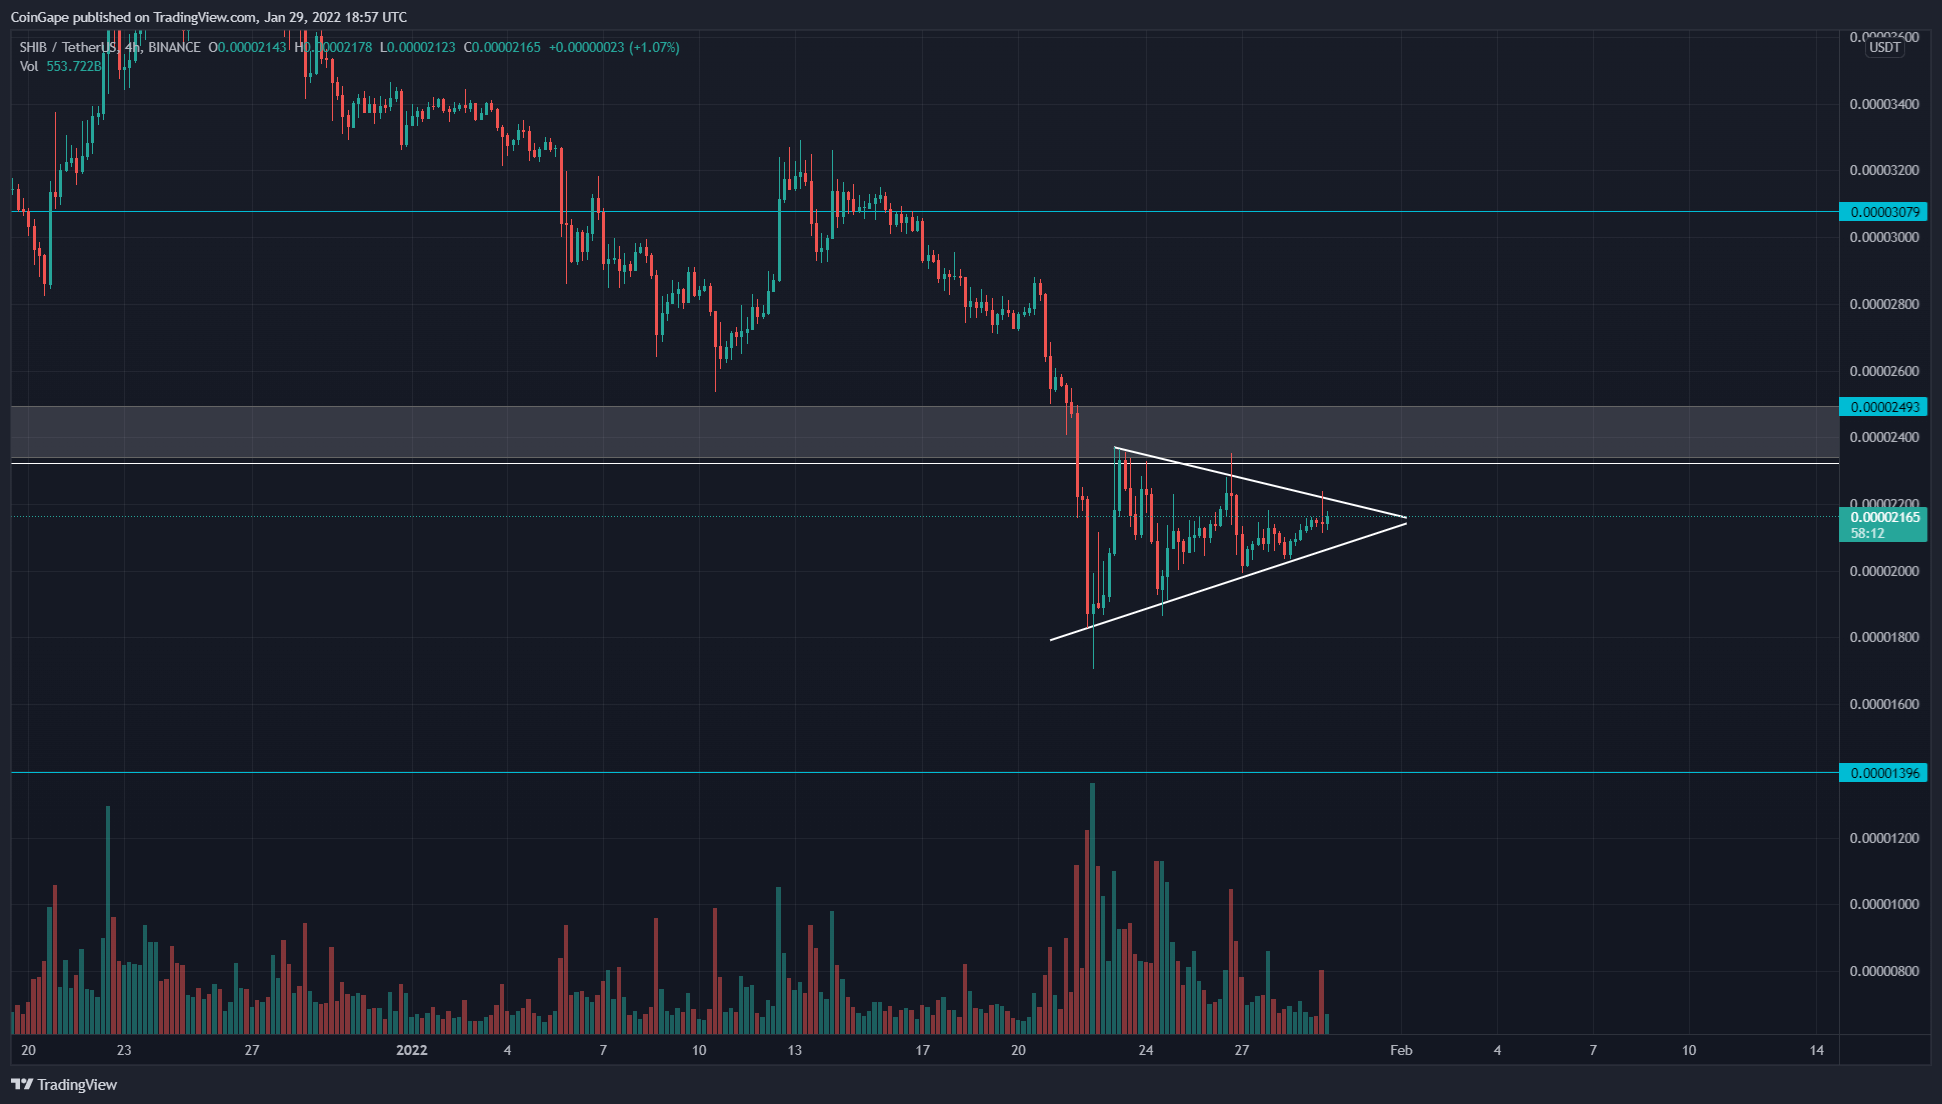
SHIB Price Forms An Inverted Pennant Pattern
 Source-Tradingview
SHIB will remain in a bearish trend until the token price is under the influence of the falling parallel channel pattern. Furthermore, the token chart shows the price is resonating in an inverted pennant pattern whose breakout could free the token price from current consolidation.
If the sellers manage to sustain the price action below the dynamic resistance, the token would sink to the $0.000014 mark(-35%)
On a contrary note, the falling channel pattern hides an excellent bullish opportunity for crypto traders if the token give an upside breakout from the resistance trendline.
- Resistance- $0.000015, $0.0000150
- Support- $0.000015, $0.0000150
Play 10,000+ Casino Games at BC Game with Ease
- Instant Deposits And Withdrawals
- Crypto Casino And Sports Betting
- Exclusive Bonuses And Rewards


Why Trust CoinGape
CoinGape has covered the cryptocurrency industry since 2017, aiming to provide informative insights Read more…to our readers. Our journal analysts bring years of experience in market analysis and blockchain technology to ensure factual accuracy and balanced reporting. By following our Editorial Policy, our writers verify every source, fact-check each story, rely on reputable sources, and attribute quotes and media correctly. We also follow a rigorous Review Methodology when evaluating exchanges and tools. From emerging blockchain projects and coin launches to industry events and technical developments, we cover all facets of the digital asset space with unwavering commitment to timely, relevant information.

Related Articles


- US-Iran War: Reports Confirm Bombings In UAE, Bahrain and Kuwait As Crypto Market Makes Recovery
- XRP Price Dips on US-Iran Conflict, But Capitulation Signals March Rebound
- Crypto Market at Risk as U.S.–Iran War Threatens Inflation With Oil Price Surge
- Polymarket U.S.–Iran Strike Bets Fuel Insider Trading Speculation as Crypto Traders Net $1.2M
- Cardano’s DeFi TVL Climbs as USDCx Stablecoin Launches on Network
- Top Analyst Predicts Pi Network Price Bottom, Flags Key Catalysts
- Will Ethereum Price Hold $1,900 Level After Five Weeks of $563M ETF Selling?
- Top 2 Price Predictions Ethereum and Solana Ahead of March 1 Clarity Act Stablecoin Deadline
- Pi Network Price Prediction Ahead of Protocol Upgrades Deadline on March 1
- XRP Price Outlook As Jane Street Lawsuit Sparks Shift in Morning Sell-Off Trend
- Dogecoin, Cardano, and Chainlink Price Prediction As Crypto Market Rebounds


