 Buy $GGs
Shiba Inu Price Analysis: What’s Ahead for SHIB Price after Reclaiming $0.000008?


SHIB Price Analysis: The Shiba Inu price received a massive boast amid the recent recovery in market leaders Bitcoin and Ethereum. This memecoin has been rising for ten consecutive days and recorded 23.55% growth as prices jumped from $0.00000645 support to the current price of $0.00000797. The bullish rally backed by increasing volume reflects the strong conviction from traders to rise higher. Can SHIB price prolong this bullish momentum, or there’s an upcoming correction wave waiting?
Also Read: Shiba Inu Burn Rate Spikes 7000%, $SHIB Price Gains And New Updates
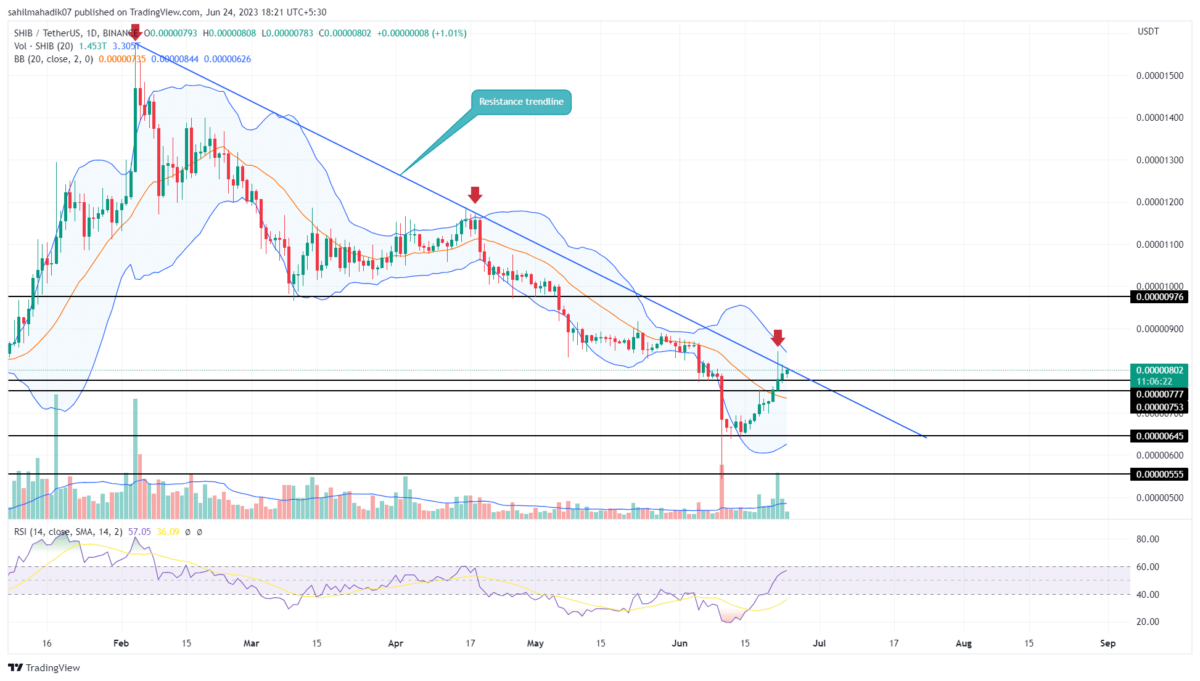
Shiba Inu Price Daily Chart:
- The Shiba Inu price could witness high support pressure at a downsloping resistance trendline
- A breakdown below $0.0000075 could plunge the coin price by 7%
- The intraday trading volume of the Shiba Inu coin is $146.2 Million, showing a 16% gain.
 Source- Tradingview
With the recent upswing in the daily chart, the Shiba Inu price reclaims the long-coming resistance trendline. The dynamic resistance is the current representation of the ongoing downtrend in the memecoin and therefore stands as an important pivotal point for traders.
On June 22nd, the daily chart showed a long-wick rejection from the downsloping trendline indicating the sellers are still active at this resistance. In case the coin price continues to show supply pressure in the coming days, the SHIB price will likely challenge the $0.0000075 immediate support to induce further downfall.
A breakdown below $0.0000075 support will increase the selling pressure and could tumble the prices back to $0.000007.
Will Shiba Inu’s Price Rally to $0.00001?
For Shiba Price to initiate a sustained recovery rally, the buyers need to give a bullish breakout from the overhead resistance trendline. This breakout could signal an early sign of trend reversal and offer traders an opportunity to go long. This post-breakout rally could drive the price 21% higher and reach the $0.00001 psychological barrier.
- Relative Strength Index: The RSI slope breakout above 60% would reflect high momentum buying among market participants.
- Bollinger Band: An upper band of the Bollinger Band indicator could provide an additional barrier against buyers and bolster a potential downfall.
Play 10,000+ Casino Games at BC Game with Ease
- Instant Deposits And Withdrawals
- Crypto Casino And Sports Betting
- Exclusive Bonuses And Rewards


Why Trust CoinGape
CoinGape has covered the cryptocurrency industry since 2017, aiming to provide informative insights Read more…to our readers. Our journal analysts bring years of experience in market analysis and blockchain technology to ensure factual accuracy and balanced reporting. By following our Editorial Policy, our writers verify every source, fact-check each story, rely on reputable sources, and attribute quotes and media correctly. We also follow a rigorous Review Methodology when evaluating exchanges and tools. From emerging blockchain projects and coin launches to industry events and technical developments, we cover all facets of the digital asset space with unwavering commitment to timely, relevant information.

Related Articles


- Peter Schiff Predicts BTC to Fall, Gold to Rise as Markets Price in Prolonged Iran War
- Institutional Re-Accumulation Signs Emerge as Bitcoin ETFs See $1.1B Net Inflows Since Iran War Began: Glassnode
- From Mining Pool to Infrastructure Platform: Nine Years of EMCD
- U.S.-Iran War: U.S. Oil Prices Spike To One-Year High, Bitcoin and Gold Dip
- Crypto Traders Bet Against U.S.-Iran Ceasefire This Month as Iran Denies Peace Talks
- HOOD Stock Targets $100 as Robinhood Unveils Platinum Card and Advance Dividend Feature
- Bitcoin Price Prediction if Donald Trump Signs the CLARITY Act on April 3, 2026
- Pi Network Price As BTC Rallies Above $74K: Can PI Coin Extend Gains to $0.30?
- XRP Price As Bitcoin Reclaims $74K- Is $5 Next?
- Dogecoin Price Outlook as BTC Recovers Above $73,000
- XRP Price Prediction as Iran-U.S. Peace Talks Trigger a Crypto Rally


