
Shiba Inu Price Analysis: Will $0.000009 Support Hold Amidst Rising FUD?


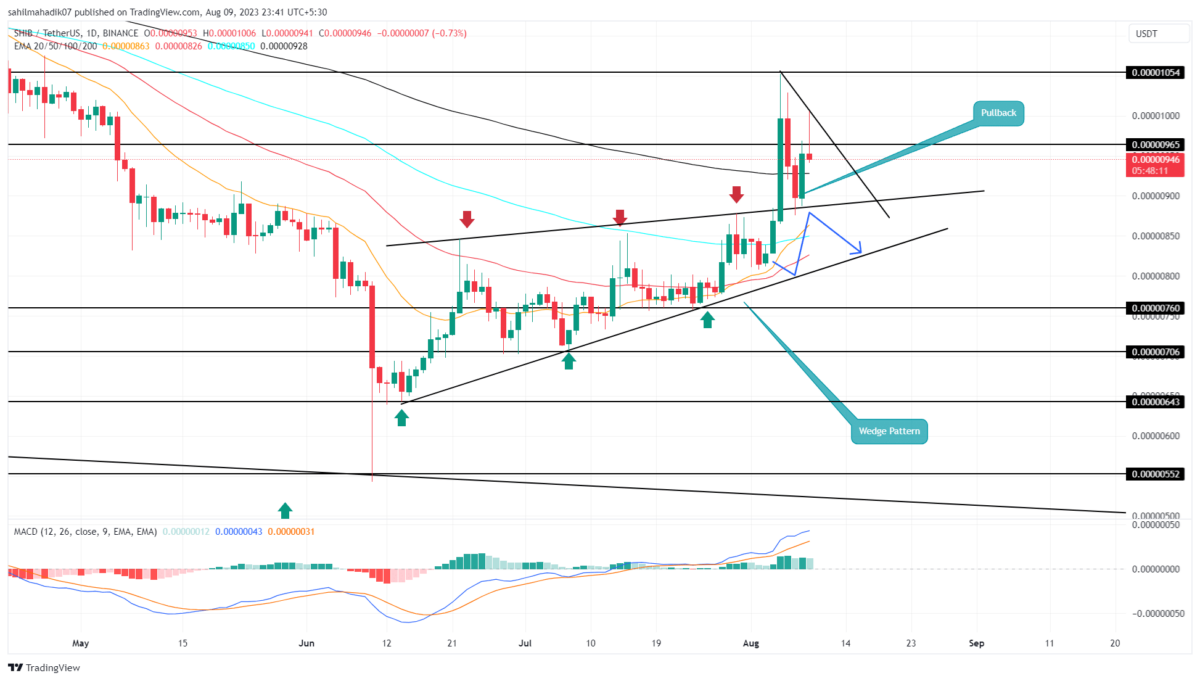
SHIB Price Analysis: On August 5th, the Shiba Inu price provided a bullish breakout from the rising wedge pattern. The coin price breaking above the resistance of the chart setup that is following an ascending trend indicates the strong bullish momentum in the market. Will this breakout assist the SHIB price to reclaim $0.00001?
Also Read: Shiba Inu (SHIB) Burn Rate Jumps 100%, Here’s Price Reaction
Shiba Inu Price Daily Chart:
- Overhead supply hints the SHIB could retrace 5% to retest the flipped support trendline.
- The coin buyers’ sustainability above $0.000009 could encourage the price to reclaim the $0.00001 milestone
- The intraday trading volume of the Shiba Inu coin is $388.2 Million, showing a 38% gain.
 Source- Tradingview
After the massive breakout of the wedge, the Shiba Inu price showed a two-day retest and checked price sustainability at higher levels. On August 7th, the coin price showed a bullish engulfing candle in the daily chart, indicating the accumulation of buyers at their new support.
However, the follow up candle today was expected to provide additional confirmation to the price rally, showing long-wick rejection. This overhead supply suggests the prices could retrace lower and replenish sufficient bullish momentum.
Amid the anticipated pullback, the SHIB holders can still maintain a bullish outlook, if the price shows sustainability above the August 7th mid-point($0.00000923) or breached the resistance trendline.
Can SHIB Price Revisit $0.000012?
While the overall trend remains bullish, the Shiba Inu buyers should manage to hold the above-filled trendline. With sustained buying, the coin price should rise 10% to hit the nearest resistance of $0.0000105, followed by $0.000012.
- Bollinger Band: An inverted hammer candle at the upper ceiling of the Bollinger Band indicates a higher possibility for a pullback.
- Moving Average Convergence Divergence: A bullish crossover state between the MACD(blue) and the signal(orange) line indicates the overall trend as bullish.
Play 10,000+ Casino Games at BC Game with Ease
- Instant Deposits And Withdrawals
- Crypto Casino And Sports Betting
- Exclusive Bonuses And Rewards


Why Trust CoinGape
CoinGape has covered the cryptocurrency industry since 2017, aiming to provide informative insights Read more…to our readers. Our journal analysts bring years of experience in market analysis and blockchain technology to ensure factual accuracy and balanced reporting. By following our Editorial Policy, our writers verify every source, fact-check each story, rely on reputable sources, and attribute quotes and media correctly. We also follow a rigorous Review Methodology when evaluating exchanges and tools. From emerging blockchain projects and coin launches to industry events and technical developments, we cover all facets of the digital asset space with unwavering commitment to timely, relevant information.


- Arthur Hayes Buys ETHFI Token Just Hours Before Upbit Listing — Coincidence?
- Breaking: Morgan Stanley Amends SEC Filing for First Bank Bitcoin ETF Under Ticker MSBT
- XRP News: Ripple-Linked Evernorth Files to Go Public With $1B XRP Treasury Plan
- FOMC Meeting Highlights March 2026: Fed Expects One Rate Cut, PCE Inflation at 2.7%
- SEC Approves Nasdaq Tokenized Securities Trading
- Will Bitcoin Price Hold $70K After Fed Reserve Keeps Rates Unchanged for 2nd Consecutive Meeting?
- Gold Price Crashed After U.S. Core PPI Came In Higher Than Expected.
- XRP Price Prediction 2026 Ahead of Major XRPL Technical Upgrades
- Will CRCL Stock Rally To $150 This Week After Clear Street Upgrade?
- Will Dogecoin Price Break $0.15 Before March End 2026?
- Bitcoin Price Forecast: Will BTC Break $80k Ahead of Fed Decision Today?


