Shiba Inu Price Analysis: Will $SHIB Price Revert from $0.0000083 or Soar to New Heights?


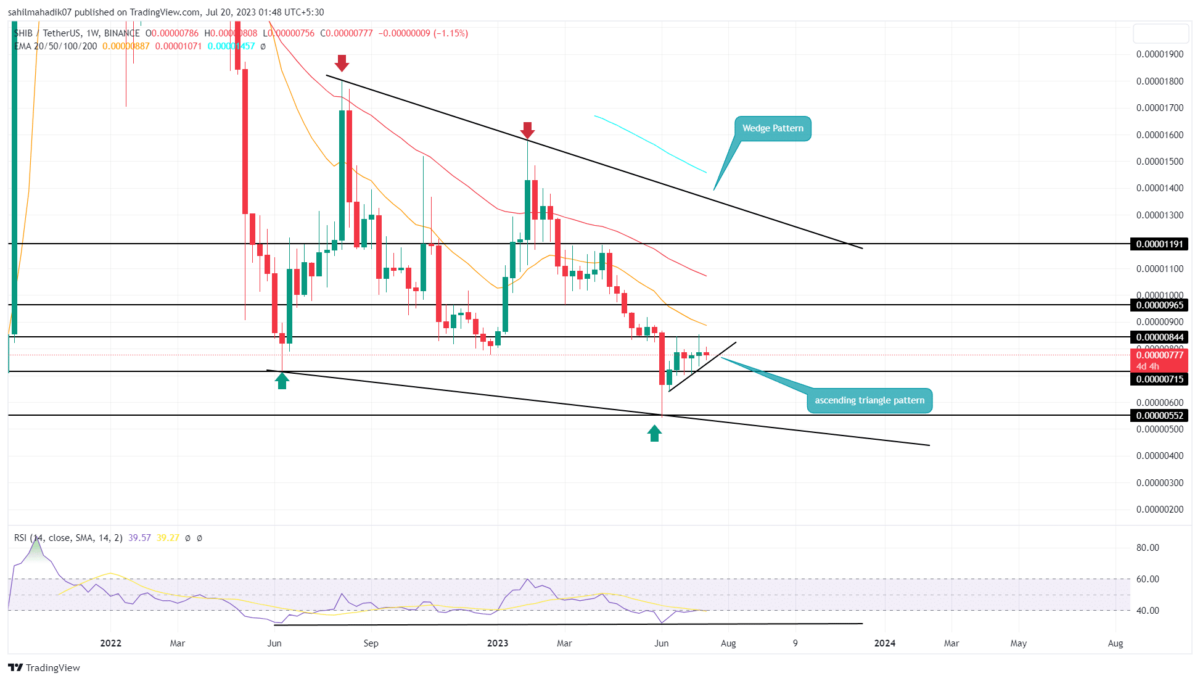
Shiba Inu Price Analysis: In the weekly time frame chart, the Shiba Inu price shows the formation of a falling wedge pattern. Under the influence of this pattern, the coin price coverage within two downsloping trendlines suggesting the downward trend is reaching maturity. However, as of now, the coin price has recently bounced back from the lower support trendline indicating a bullish reversal within the pattern’s range.
Also Read: Shiba Inu Team Denounces LEASH Impersonator
Shiba Inu Price Daily Chart:
- An ascending triangle pattern carries the current recovery phase in SHIB price.
- A bullish breakout from $0.00000845 will set the memecoin for a bullish upswing to $0.00000965
- The intraday trading volume of the Shiba Inu coin is $89.2 Million, showing a 6.53% gain.
 Source- Tradingview
After the early June sell-off, the Shiba Inu price rebounded from the support trendline of the wedge pattern. The bullish reversal triggered a bull cycle with the pattern and ideally set a rally back to the overhead trendline.
The fresh rally surged the popular memecoin by 55% and reached the $0.00000845 barrier. Amid the current uncertainty, in the crypto market, the buyers are struggling to break this resistance and create a short consolidation below.
However, this consolidation shaped into an ascending triangle pattern in the daily time frame chart, indicating the SHIB price is witnessing gradual accumulation from buyers. In response to this pattern, the memecoin could break the $0.00000845 as a signal to uptrend continuation.
What if SHIB Price Breaks $0.00000845 Barrier?
If the overhead supply at $0.00000845 resistance persists, the Shiba Inu price may prolong the sideways trend for a few more trading days. However, the converging range of the ascending triangle pattern will eventually lead to a breakout move, with more probability of surpassing $0.00000845. This breakout could offer potential buyers an opportunity and lead the price rally to $0.00000965, followed by $0.0000119.
- Relative Strength Index: Despite a lower low formation in SHIB price, the daily RSI slope forming the same low indicates the increased accumulation from buyers and therefore potential for recovery.
- Exponential Moving Average: The SHIB price below the 100 EMA of the weekly chart indicates the long-term trend is bearish.

Why Trust CoinGape
CoinGape has covered the cryptocurrency industry since 2017, aiming to provide informative insights Read more…to our readers. Our journal analysts bring years of experience in market analysis and blockchain technology to ensure factual accuracy and balanced reporting. By following our Editorial Policy, our writers verify every source, fact-check each story, rely on reputable sources, and attribute quotes and media correctly. We also follow a rigorous Review Methodology when evaluating exchanges and tools. From emerging blockchain projects and coin launches to industry events and technical developments, we cover all facets of the digital asset space with unwavering commitment to timely, relevant information.

Related Articles


- Bitcoin vs Gold Feb 2026: Which Asset Could Spike Next?
- Top 3 Reasons Why Crypto Market is Down Today (Feb. 22)
- Michael Saylor Hints at Another Strategy BTC Buy as Bitcoin Drops Below $68K
- Expert Says Bitcoin Now in ‘Stage 4’ Bear Market Phase, Warns BTC May Hit 35K to 45K Zone
- Bitcoin Price Today As Bulls Defend $65K–$66K Zone Amid Geopolitics and Tariffs Tensions
- COIN Stock Price Prediction: Will Coinbase Crash or Rally in Feb 2026?
- Shiba Inu Price Feb 2026: Will SHIB Rise Soon?
- Pi Network Price Prediction: How High Can Pi Coin Go?
- Dogecoin Price Prediction Feb 2026: Will DOGE Break $0.20 This month?
- XRP Price Prediction As SBI Introduces Tokenized Bonds With Crypto Rewards
- Ethereum Price Rises After SCOTUS Ruling: Here’s Why a Drop to $1,500 is Possible


