Shiba Inu Price Prediction As Next Leap In Recovery Hints 20% Rise


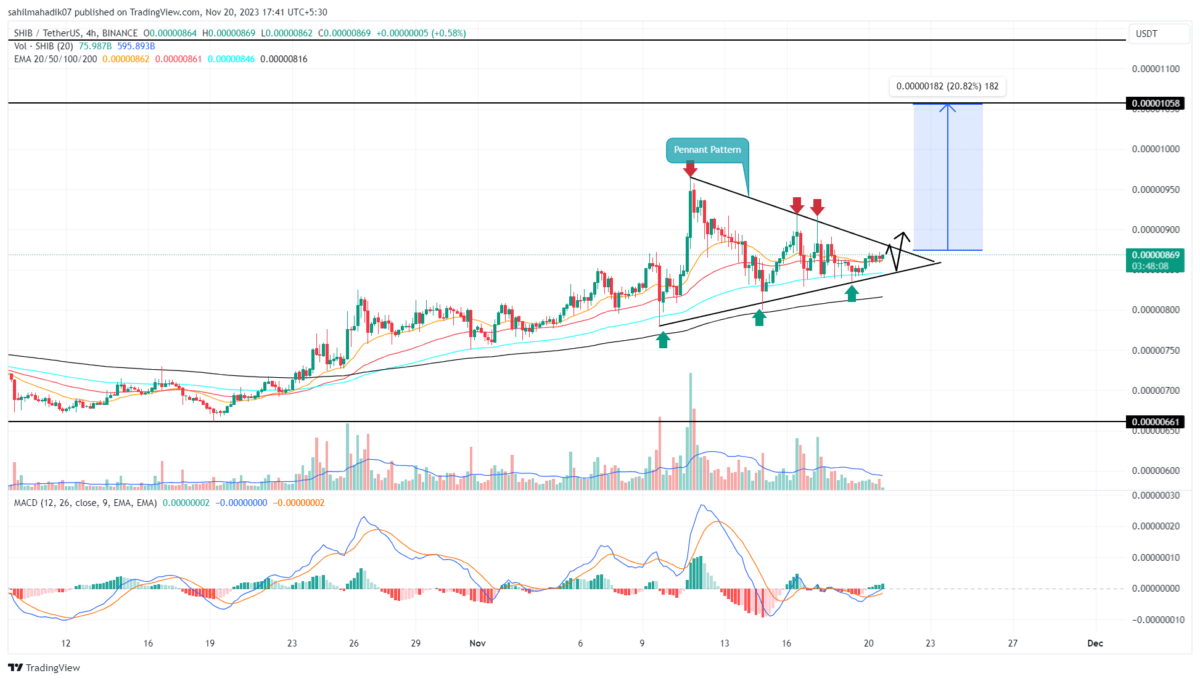
Shiba Inu Price Prediction: After creating a local top at $0.05, the SHIB price recovery turned sideways resonating within the two converging trend lines of a pennant pattern. The alternate order of green and red daily candles indicates no clear dominance of either party. However, with the prevailing bullish trend and uptrend continuation pattern, the SHIB price is likely to resume on a recovery path.
Also Read: Shiba Inu’s Shibarium Ranks in Top 5 on NOWNodes Network
Can the SHIB Price Rise to $0.0000012?
- In response to the pennant pattern, the SHIB price is likely to consolidate longer before giving a decisive breakout.
- The pennant pattern should assist buyers in surpassing the $0.00001 mark
- The intraday trading volume of the Shiba Inu coin is $112.5 Million, showing a 12.7% loss.
 Source- Tradingview
For nearly two weeks, the Shiba Inu coin price has been trading sideways, gradually developing a bullish pennant pattern in the 4-hour time frame. In theory, this minor consolidation recharges buying pressure before the next leap.
By the press time, the SHIB price trades at $0.0000087, and with a modest growth of 0.3%, the market sentiment is wavering in uncertainty, However, under the influence of this pattern, the prices are likely to resonate in the coming few days before giving a decisive breakout on the upside.
This breakout will release the buying momentum and surge the price 22% higher to hit the initial target of $0.00001058. However, an extended target for this pattern is the pole length of the pennant shot from the breakout point, indicating the $0.000012 as the next milestone.
Has the Uptrend Started?
The weekly time frame chart shows the long-term trend in Shiba Inu price is down under the influence of a falling wedge pattern. For nearly nineteen months, the coin price resonated within two downsloping trendlines acting as crucial resistance and support. If the anticipated rally plays true, the coin price may have an intense supply at the overhead trendline around $0.00135. Thus, a breakout from this barrier would be a better signal of a bullish trend.

Why Trust CoinGape
CoinGape has covered the cryptocurrency industry since 2017, aiming to provide informative insights Read more…to our readers. Our journal analysts bring years of experience in market analysis and blockchain technology to ensure factual accuracy and balanced reporting. By following our Editorial Policy, our writers verify every source, fact-check each story, rely on reputable sources, and attribute quotes and media correctly. We also follow a rigorous Review Methodology when evaluating exchanges and tools. From emerging blockchain projects and coin launches to industry events and technical developments, we cover all facets of the digital asset space with unwavering commitment to timely, relevant information.
24 Hours volume
$114.54M
Market Cap
$3.56B
Max Supply
1000T