 Buy $GGs
Shiba Inu Price Prediction: Inverse Head $ Shoulders Tests Critical Zone – Is a Breakout Still in Play?


Highlights
- Inverse head and shoulders keeps Shiba Inu price recovery structure intact
- The $0.0000080 support defines whether the breakout scenario stays valid
- Derivatives positioning shows patience, not aggressive speculative behavior
Shiba Inu price has slowed after a strong recovery attempt, with the price now moving back and forth between clearly defined support and resistance. Rather than moving upwards, price action has stalled, indicating a change in momentum-based trading to a more thoughtful structure-based stage.
The shift is as more macro-level crypto factors are still delicate, particularly to the stability of Bitcoin that still forms the basis of short-term risky conduct. As SHIB tests a critical zone, the market is now focused on whether this recovery structure can hold, keeping the future Shiba Inu price prediction alive.
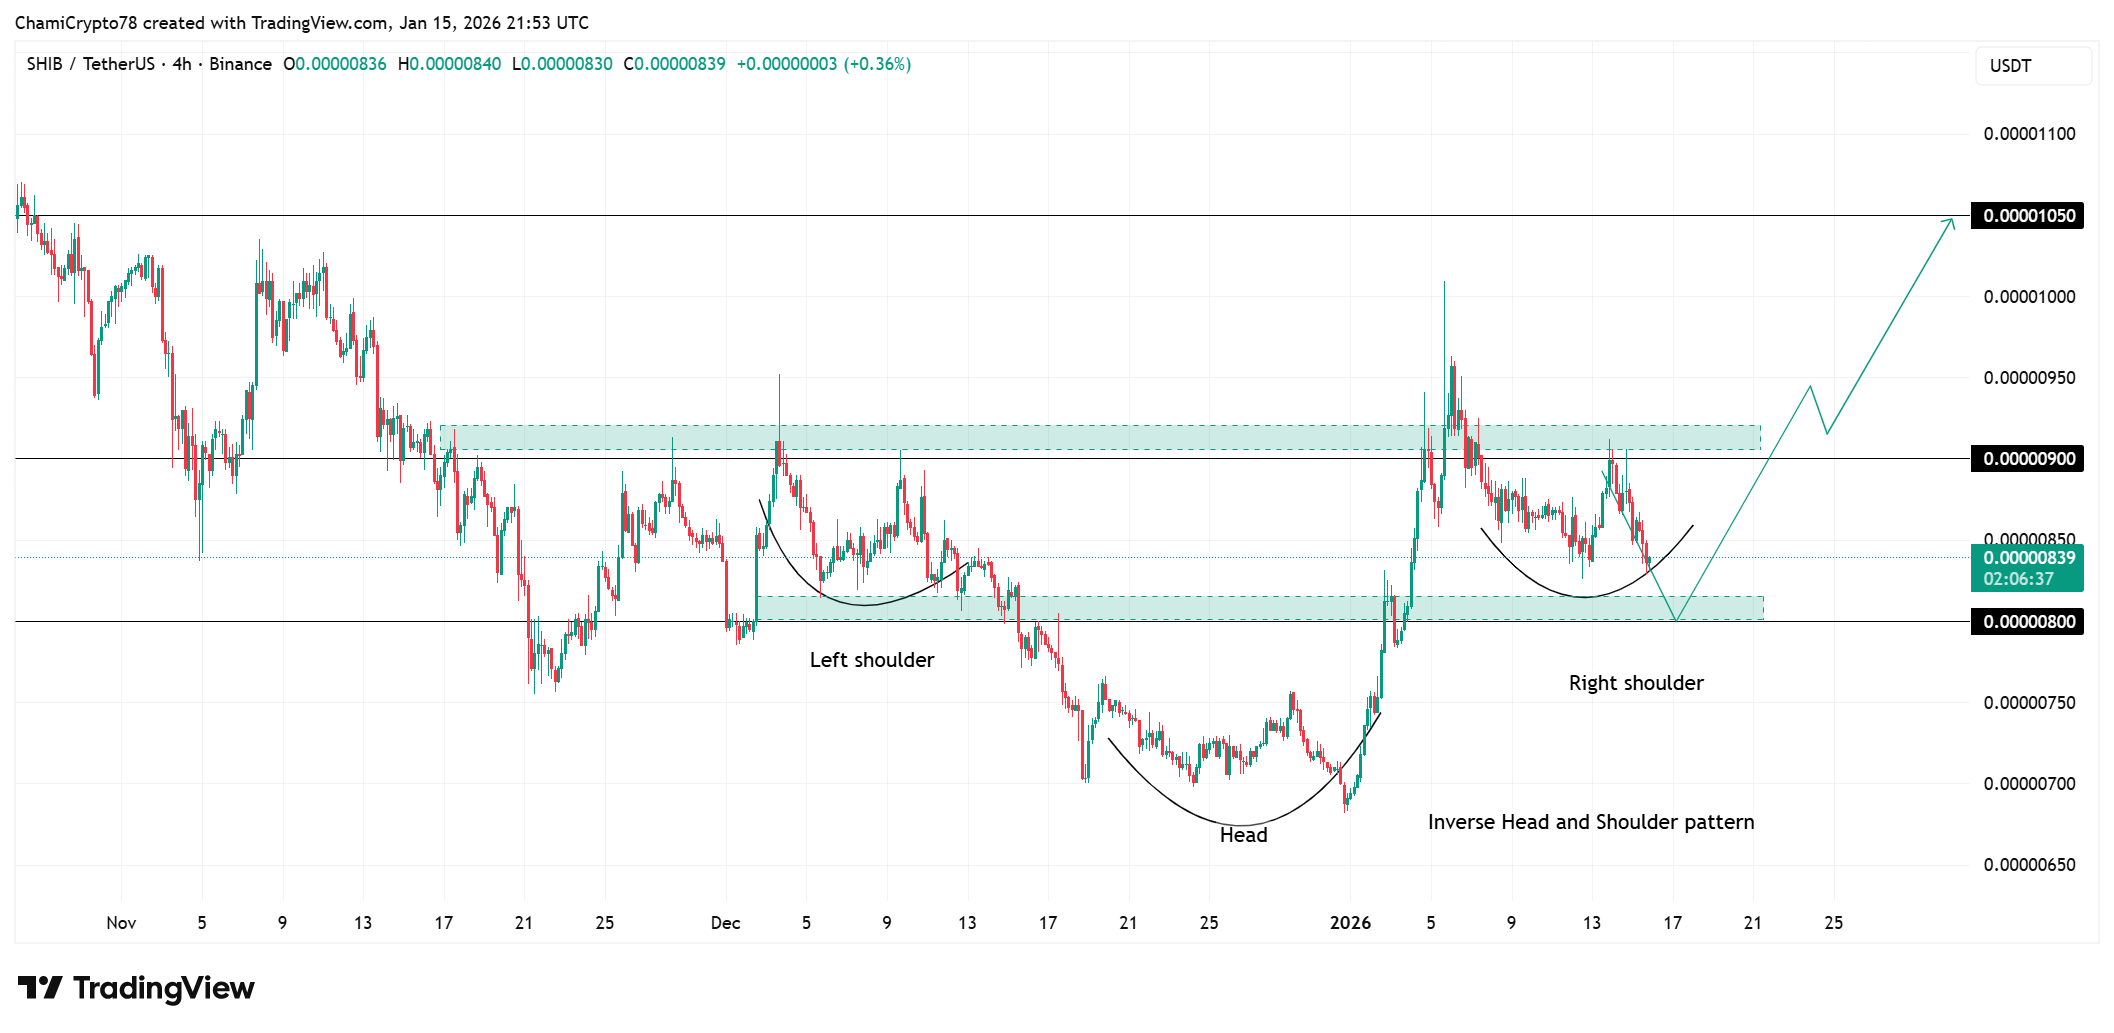
Shiba Inu Price Forms Inverse Head and Shoulders on 4H Chart
Shiba Inu price on the 4-hour chart has shaped into an inverse head and shoulders pattern. The formation often appears when selling pressure begins to fade rather than expand. The left shoulder developed in early December and then the sellers slightly moved the price down in late December forming the head of the structure.
The drop that followed, however, was not followed through. The market demand intervened promptly, indicating depletion instead of rejuvenated downside control.
As price rebounded, the right shoulder formed in early January once SHIB price reclaimed the $0.000008 level, flipping a former ceiling into support. There, the momentum of upside diminished around $0.0000090, leading to a pullback toward $0.0000080.
Notably, this action resembles more of digestion than weakness, because price still respects higher lows in the construction. SHIB market value sits around $0.00000837 at the time of press, after a rejection from the key resistance.
As long as $0.0000080 holds, price action favors another push toward $0.0000090, with a clean break opening the door to $0.00001050 by end Q1, supporting the long-term Shiba Inu price prediction. However, a loss of $0.0000080 would cancel this price structure and hand control back to sellers.
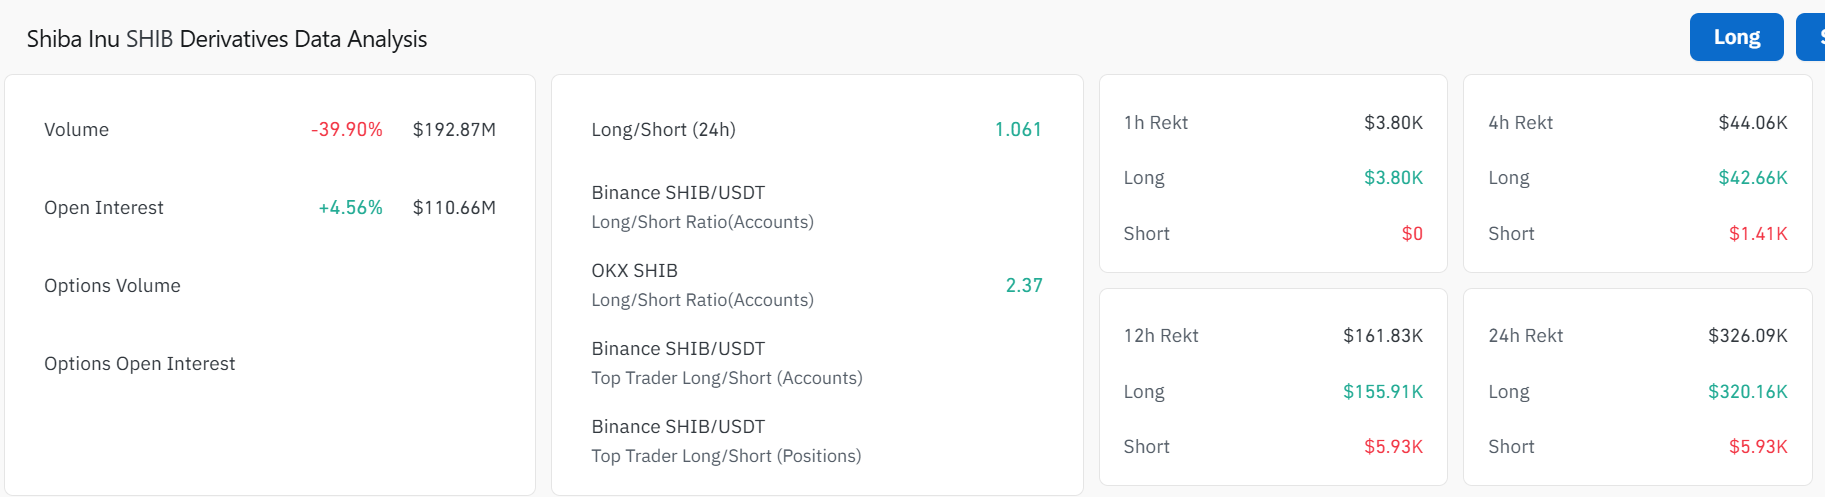
SHIB Derivatives Data Analysis Shows Patience Positioning
Shiba Inu price behavior lines up with derivatives analytics that suggest caution rather than conviction. The trading volume has decreased 40% to $192.87M , an indication of less reactive trades as the price consolidates. However, the open interest has increased by 4.56% to $110.66M. The mild rising open interest shows that traders are still setting up to make a move rather than completely stepping out.
Looking closer, the long-to-short ratios show that there is a moderate long bias and no overcrowding. Binance accounts stand at 1.061 and the optimism of OKX is higher at 2.37, but still controlled. The liquidations figures further support this view. In a 24-hour timeframe, total liquidations hot $326K, with about $320K coming from longs and only around $6K from shorts.
The imbalance depicts that longs will absorb pullbacks without panicking whereas shorts are reluctant to push lower. As a result, SHIB price continues to consolidate in an orderly manner. But, when $0.0000080 is broken, then that forbearance would tend to vanish, and a more rapid unwind of long exposure will commence.
To sum up, a breakout remains possible for Shiba Inu price, however not guaranteed. The inverse head and shoulders pattern keeps the bullish case intact, as long as the $0.0000080 support holds.
If buyers take control around the support, SHIB will attempt a move toward $0.0000090 and potential go higher. However, a decisive break below support would invalidate the structure entirely, shifting the long-term Shiba Inu price prediction back into a defensive stance.
Play 10,000+ Casino Games at BC Game with Ease
- Instant Deposits And Withdrawals
- Crypto Casino And Sports Betting
- Exclusive Bonuses And Rewards

Frequently Asked Questions (FAQs)
1. What does the inverse head and shoulders pattern signal?
2. How does derivatives data support the current structure?
3. Why is Bitcoin’s behavior relevant to SHIB right now?

Why Trust CoinGape
CoinGape has covered the cryptocurrency industry since 2017, aiming to provide informative insights Read more…to our readers. Our journal analysts bring years of experience in market analysis and blockchain technology to ensure factual accuracy and balanced reporting. By following our Editorial Policy, our writers verify every source, fact-check each story, rely on reputable sources, and attribute quotes and media correctly. We also follow a rigorous Review Methodology when evaluating exchanges and tools. From emerging blockchain projects and coin launches to industry events and technical developments, we cover all facets of the digital asset space with unwavering commitment to timely, relevant information.

Related Articles


- Vitalik Buterin Maps Out Quantum Risks as Ethereum Foundation Unveils ‘Strawmap’
- BlackRock Adds $289M in BTC as Bitcoin ETFs Log 2-Week High Inflows Of $500M
- Glassnode Signals Bitcoin Still Faces Downside Risk Amid Massive Sell Pressure at $70K
- U.S House Introduces Bipartisan Crypto Bill To Protect Crypto Developers Amid DeFi Push Under CLARITY Act
- XRP News: Ripple Unveils Funding Hub To Support Innovation On XRPL
- Top 2 Price Predictions Ethereum and Solana Ahead of March 1 Clarity Act Stablecoin Deadline
- Pi Network Price Prediction Ahead of Protocol Upgrades Deadline on March 1
- XRP Price Outlook As Jane Street Lawsuit Sparks Shift in Morning Sell-Off Trend
- Dogecoin, Cardano, and Chainlink Price Prediction As Crypto Market Rebounds
- Will Solana Price Rally to $100 If Bitcoin Reclaims $72K?
- XRP Price Eye $2 Rebound as On-Chain Data Signals Massive Whale Accumulation


