
Shiba Inu Price Prediction: Will $SHIB Price Sustain $0.00001 In June?


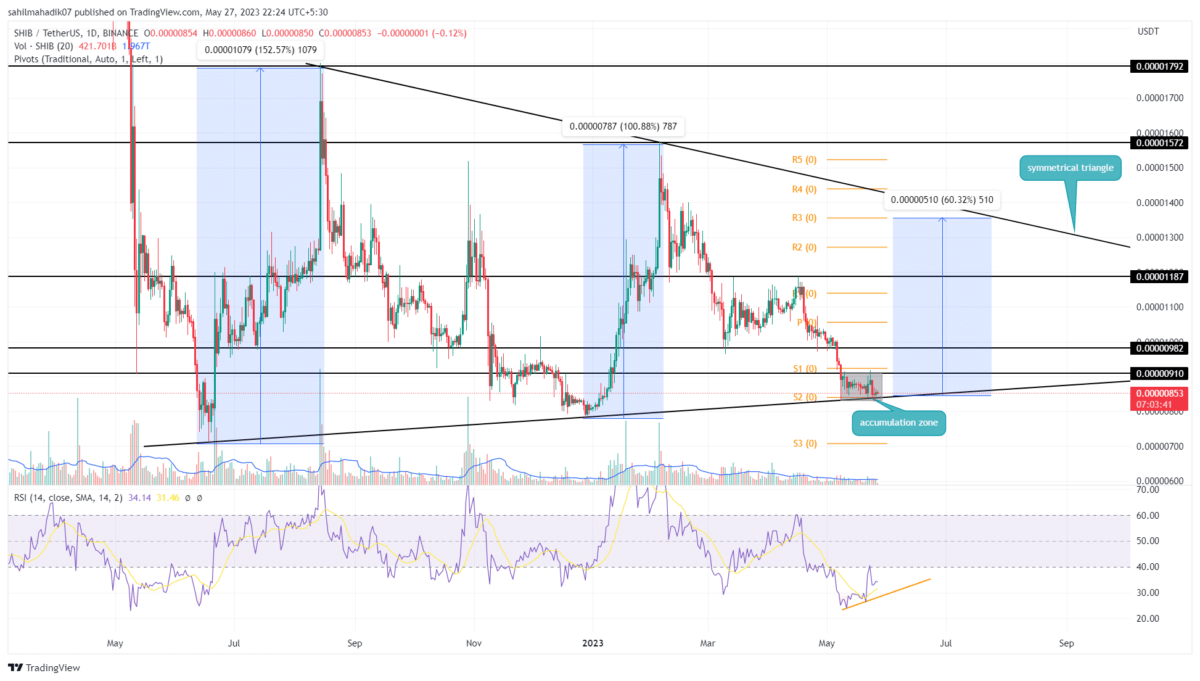
Shiba Inu Price Prediction: For the past three weeks, the Shiba Inu price has been hovering above the long-coming support trendline of the symmetrical triangle pattern. During this consolidation, the sellers’ failure to obtain follow-up on their attack(red candles) indicated a sign of active accumulation. As no trend remains forever in any asset, the SHIB price is more likely to surge higher in the future.
Also Read: Dormant Shiba Inu Whale Shifts 500 Billion SHIB; Dump Ahead?
Shiba Inu Price Daily Chart
- Accumulation at crucial. support sets the Shiba Inu price for a significant upswing
- An upside breakout from $0.000009 will offer a long-entry opportunity to traders.
- The intraday trading volume of the Shiba Inu coin is $56.9 Million, showing a 40% loss.
 Source- Tradingview
By the press time, the Shiba Inu price trades at $0.00000855 and continues on its sideways journey within the angular support trendline and $0.0000091 horizontal resistance. Moreover, the formation of a Doji candle on the daily chart suggests that traders lack conviction in determining the coin’s direction, indicating that consolidation may continue for a few more days.
However, the historical data shows that the support trendline of the triangle pattern previously led to significant upward movements. Specifically, in the period from June to August 2022, the price experienced a bull run of 155%, and another rally of 101% in January 2023.
If a bullish breakout occurs above the immediate resistance level of $0.0000091, it could signify the beginning of a fresh recovery rally. In such a scenario, the SHIB price may experience a surge of approximately 50%, potentially reaching the overhead trendline.
Will Shiba Inu Price Surpass $0.00001?
In its core concept, a bullish reversal from the support trendline from the triangle pattern usually drives a rally back to the overhead trendline. Thus, a potential reversal from the lower trendline will surge the coin price back to $0.0000092 and $0.00001 as its potential target lies near $0.0000136.
- Relative Strength Index: Despite the sideways price action, a closer look at the daily chart reveals a rising slope in the Relative Strength Index (RSI). This bullish divergence indicates the buying pressure rising at a lower trendline and additional confirmation for a potential rally.
- Pivot levels: The support/resistance indicator projects the Shiba Inu price may face overhead supply at $0.00000924 and $0.00001055 and on the flip side, the $0.00008 and $0.000007 stands as crucial demand zones.
Play 10,000+ Casino Games at BC Game with Ease
- Instant Deposits And Withdrawals
- Crypto Casino And Sports Betting
- Exclusive Bonuses And Rewards


Why Trust CoinGape
CoinGape has covered the cryptocurrency industry since 2017, aiming to provide informative insights Read more…to our readers. Our journal analysts bring years of experience in market analysis and blockchain technology to ensure factual accuracy and balanced reporting. By following our Editorial Policy, our writers verify every source, fact-check each story, rely on reputable sources, and attribute quotes and media correctly. We also follow a rigorous Review Methodology when evaluating exchanges and tools. From emerging blockchain projects and coin launches to industry events and technical developments, we cover all facets of the digital asset space with unwavering commitment to timely, relevant information.


- Breaking: Crypto Market Falls Sharply After Attack on Iran’s South Pars Gas Field
- 10x Research Warns Fed Rate Hike, US CPI Rising to 3.4% While China Taps 1.4 Bln Oil Reserves
- Ripple News: XRP Reclaims Fourth Spot From BNB as ETF Inflows Cross $1.2 Billion
- Will Cryptocurrency Market Recover Further as WSJ Flags Growing Fed Dissent for Rate Cut?
- Vitalik Buterin Says Ethereum Is About to Get a Lot Faster, But There’s a Catch
- Will Dogecoin Price Break $0.15 Before March End 2026?
- Bitcoin Price Forecast: Will BTC Break $80k Ahead of Fed Decision Today?
- MSTR Stock Prediction as Strategy Makes Largest Bitcoin Purchase in 2026 and Analyst Targets BTC Price $100K
- Pi Network Price Prediction After Smart Contract and Second Migration Launch
- Pepe Coin Price Surges 20%- How High Can it Go in March?
- Is XRP Price Gearing Up For $2 Level As BTC Rebounds Above $74k?


