
Shiba Inu Price Prediction: Will SHIB Show Golden Cross Signal in 2026?


Highlights
- SHIB trades in a base where EMA convergence conditions for a Golden Cross are forming.
- Descending wedge compression and demand absorption support early trend-transition mechanics.
- Momentum improvement and rising Open Interest reinforce the structural crossover thesis.
Discussion around a potential Golden Cross in 2026 has intensified as Shina Inu price compresses instead of breaking decisively lower. This is important since Golden Cross set-ups are the results of long-term stabilization, rather than sudden rallies as the 50-EMA crosses above the 200-EMA.
SHIB price has spend months trading below resistance and interacting continuously with a well-defined demand base. This framework will dictate whether the moving averages will converge by 2026 or will be stuck in the bearish position.
Will Shiba Inu Price Structure Form a Golden Cross in 2026?
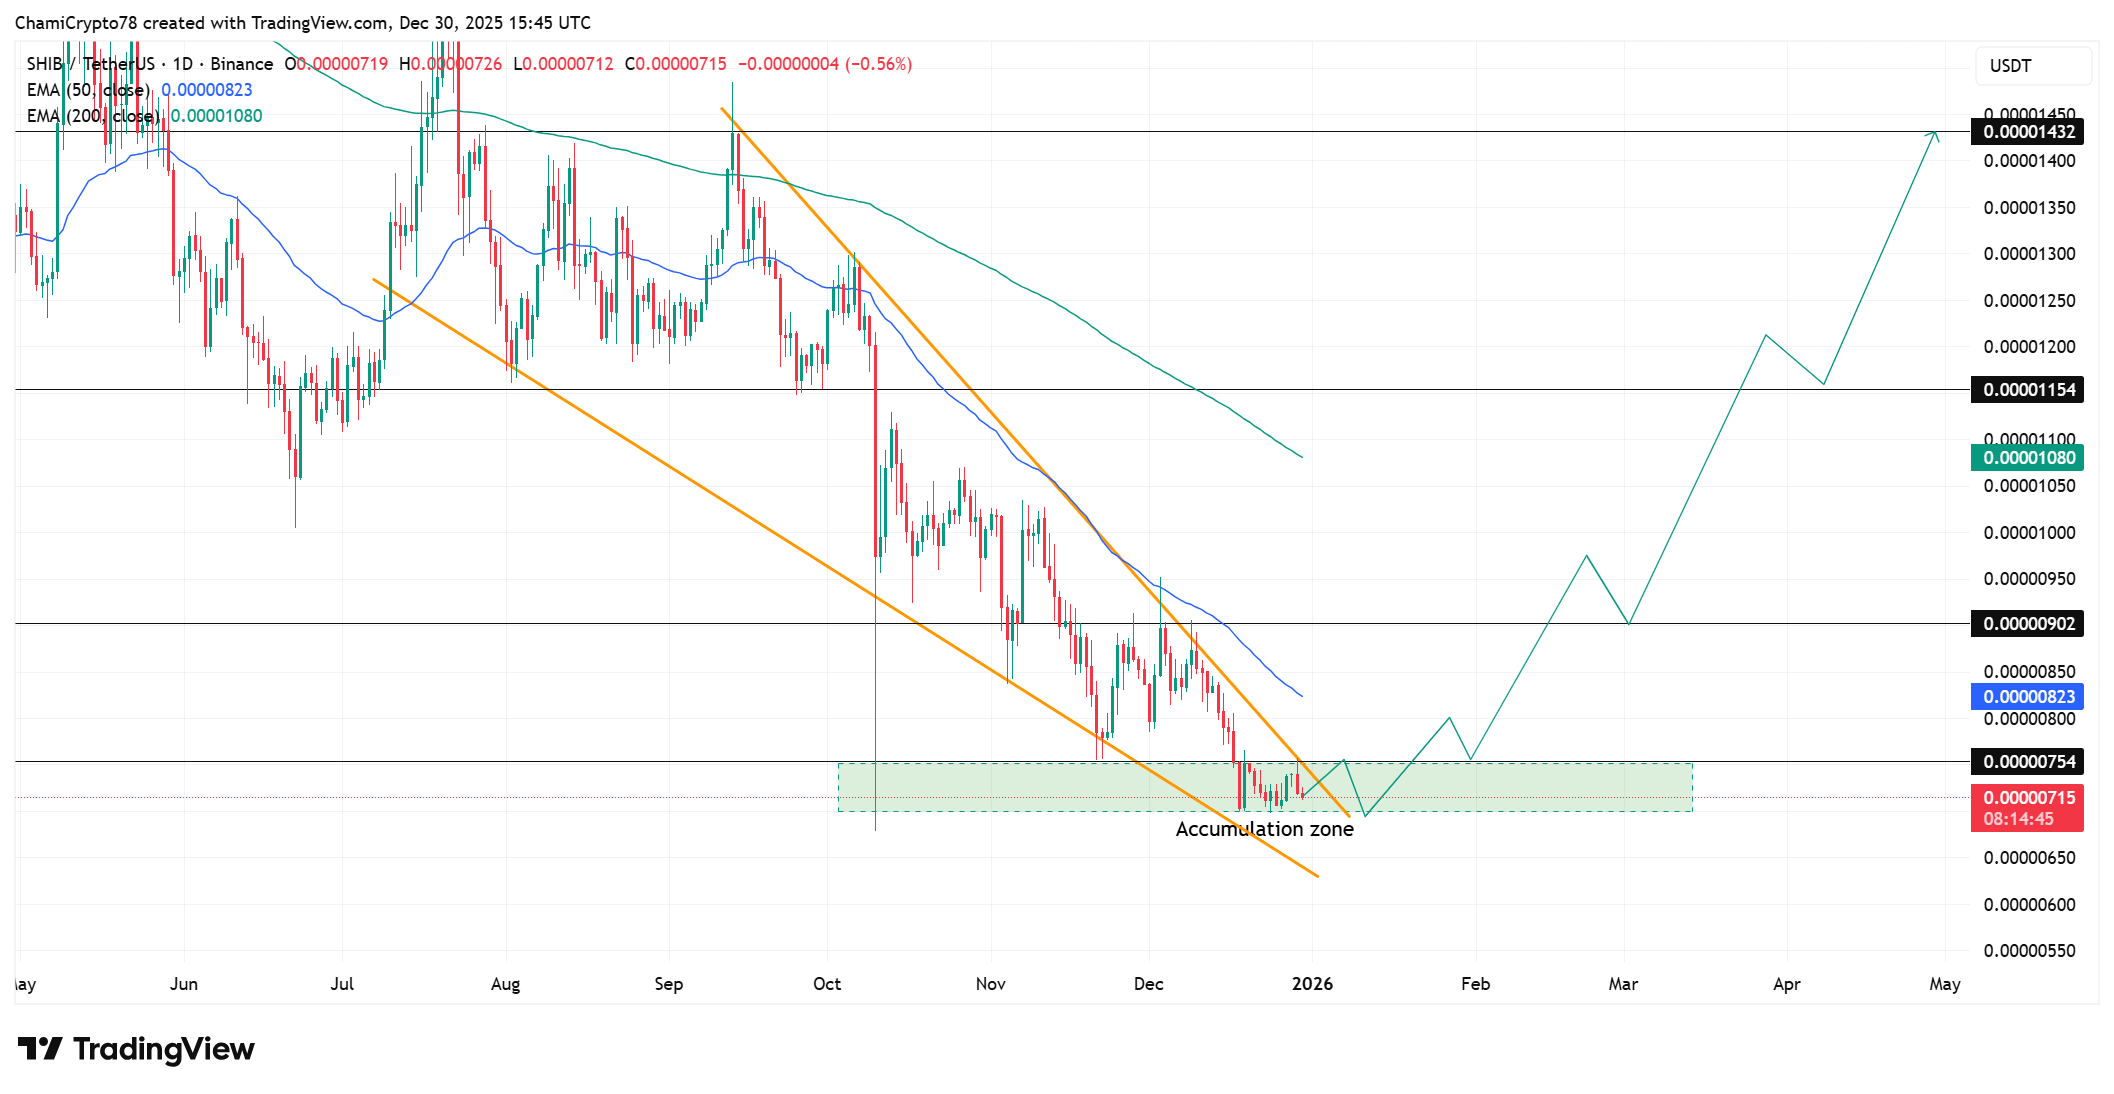
At the time of press, Shina Inu value sits at $0.00000715 and it is above a clearly defined demand zone. SHIB price still reveres the $0.0000070-$0.0000075 range, with repeated sells not yielding follow-through.
Shrinking candle ranges and muted downside extensions show active absorption rather than aggressive distribution, helping price form a base.
This behavior strengthens the probability of a golden cross formation because the 50 EMA already sits below the 200 EMA, which is the correct structural positioning for a bullish crossover. However, positioning alone does not ignite a golden cross.
Price will have to regain structure and grow upwards to push EMA convergence. A clear move out of the descending wedge and the continued acceptance of the price above $0.0000082 would probably accelerate the upward movement and narrow the gap between the two averages.
Besides, trading around the demand zone also plays a critical role. Holding above $0.0000070 continued is long enough to allow EMA flattening to occur.
If a golden cross develops, SHIB price might rebound to $0.0000090, then to $0.0000115, and eventually $0.00001432 as the trend strength is restored. However, a failure to hold above $0.0000070 level will invalidate this price set up and further delay the crossover.
Indicators Support Base Strength Shaping SHIB Price Outlook
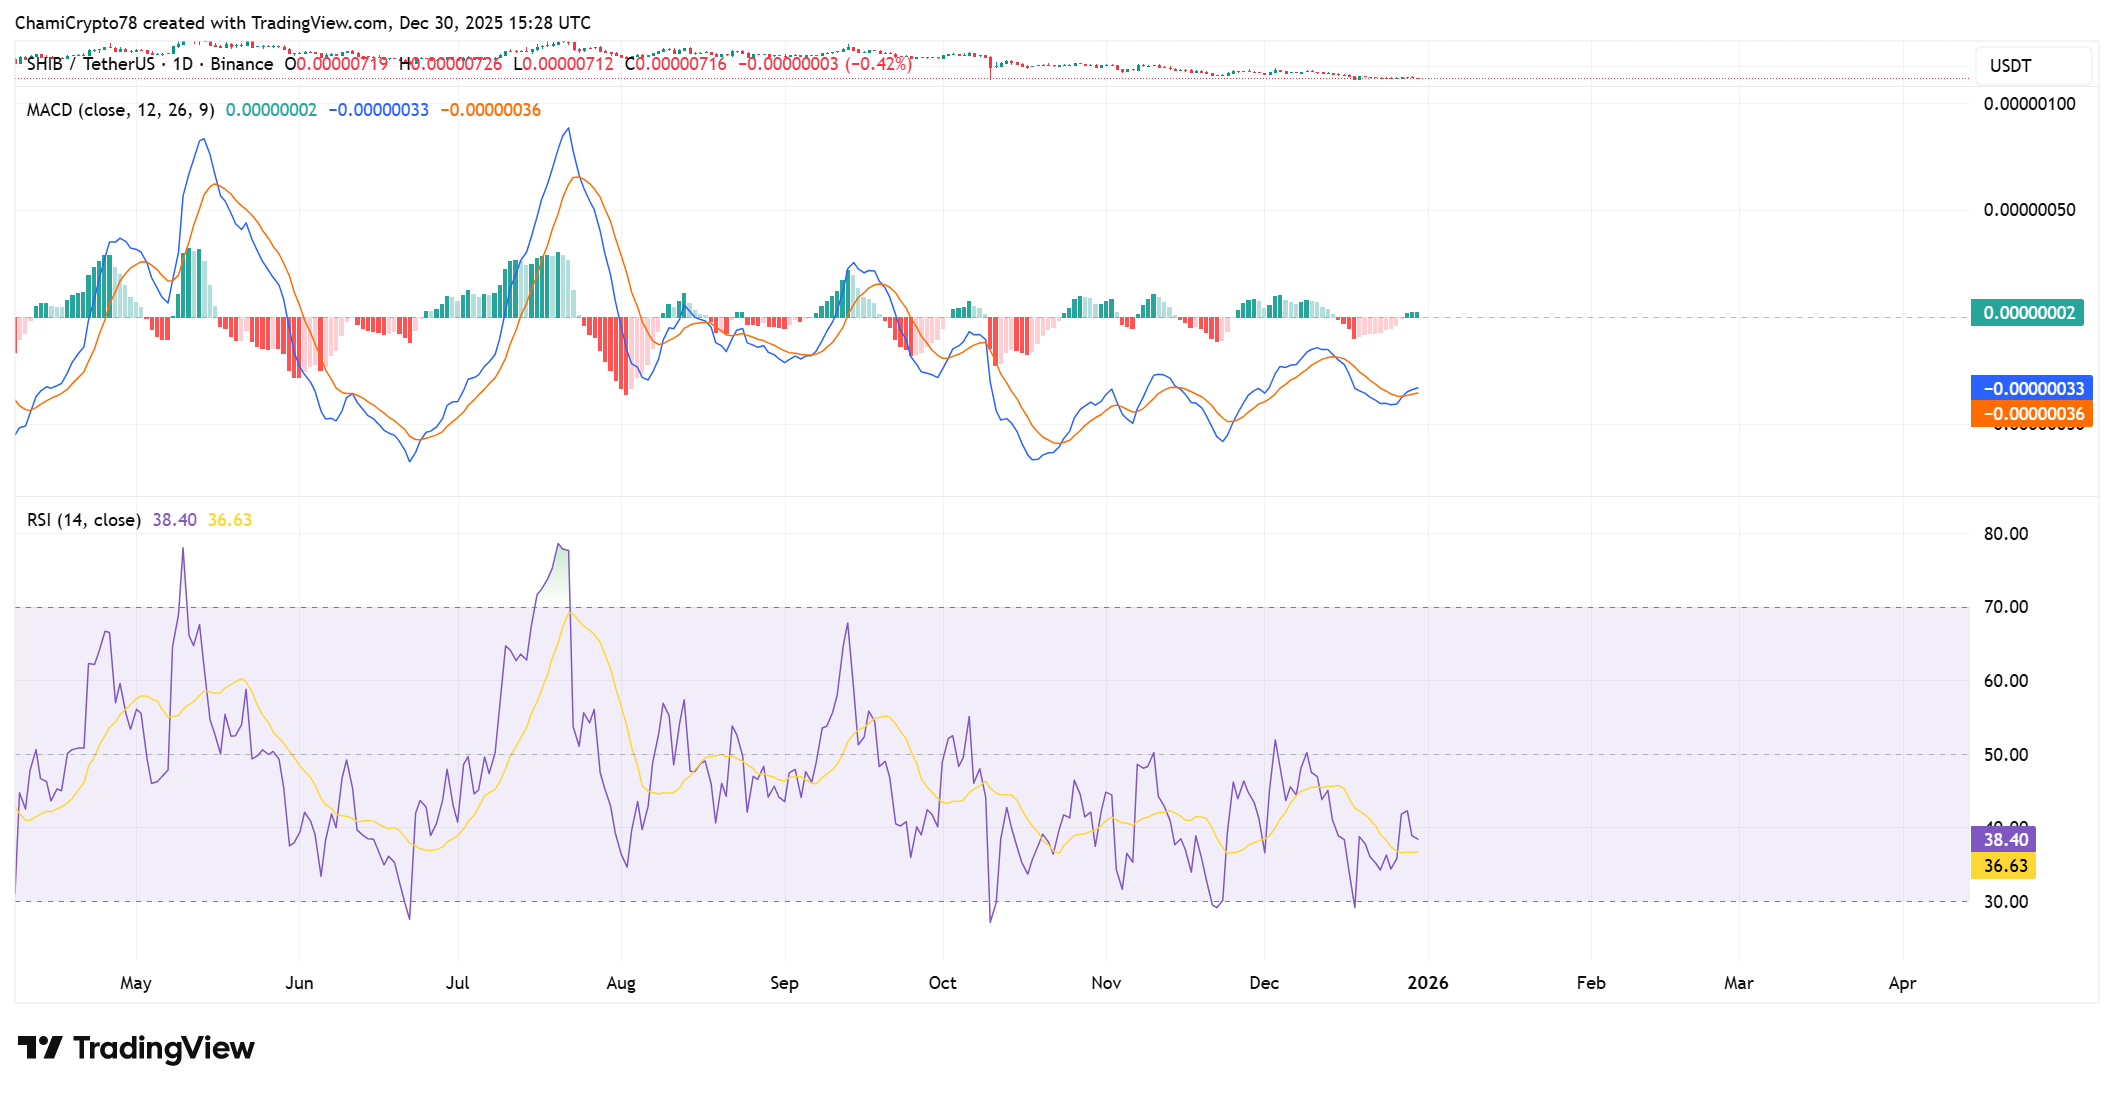
Notably, indicators reinforce stabilization rather than trend reversal at the moment. The RSI sit at around 38, indicating bearish pressure with no oversold growth. This action is consistent with price holding demand and indicates the declining downside efficiency instead of the revitalized strength of selling.
MACD is still in the negative but the MACD line has crossed the signal line and the bars on the histogram have begun to appear positive. This change is an indication of a positive short-term momentum in the consolidation, rather than a complete turnaround.
These signal-line crossovers can be common at early base phases and can often be the forerunners of EMA slope changes.
Should the SHIB price overcome the downward channel and create higher lows, this positive momentum pattern would probably continue. This would favor the gradual convergence of the 50 EMA and the 200 EMA, strengthening the long-term SHIB price outlook.
Open Interest Rises as Despite Daily Price Decline
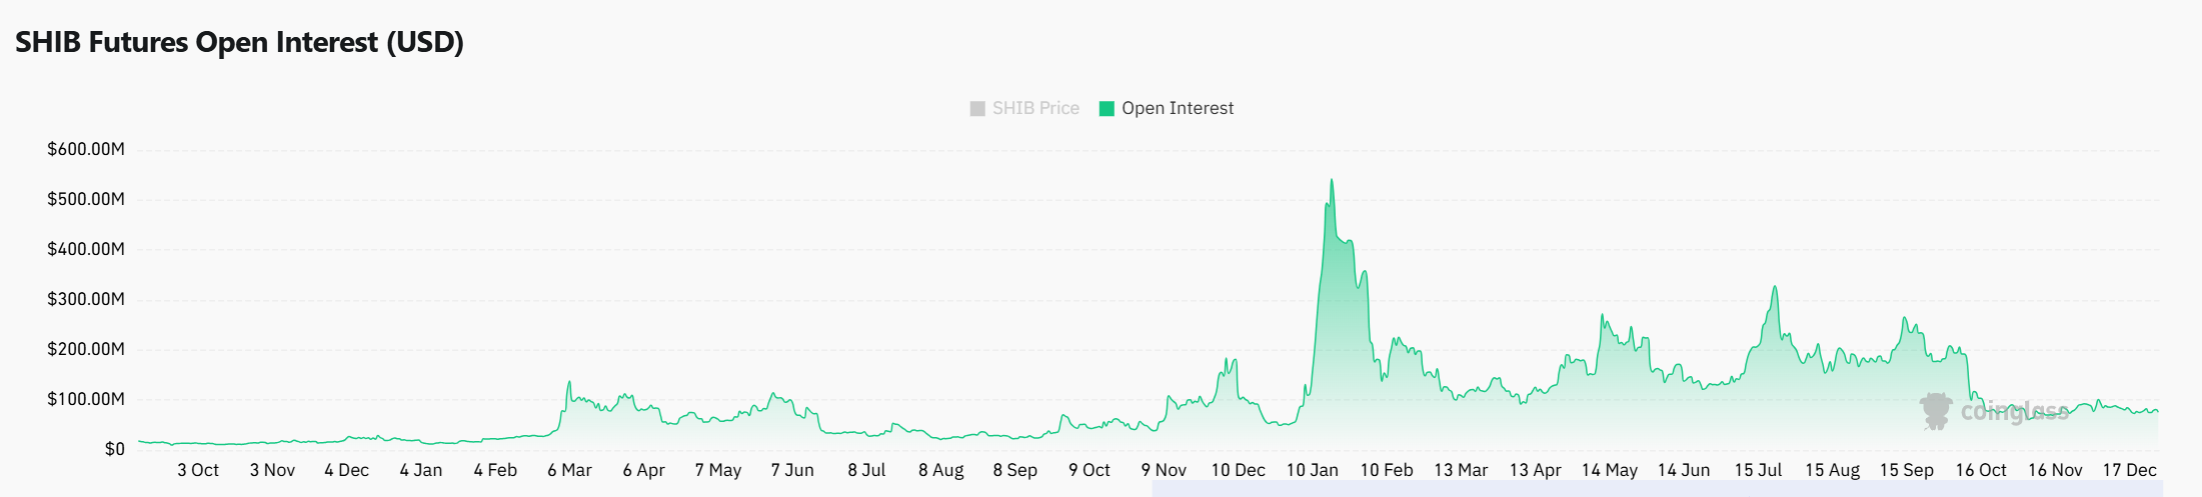
Additionally, the open interest rose by roughly 6%, lifting total OI toward $81 million, despite a daily price decline of 3.58%. This deviation indicates that traders are putting exposure on consolidation as opposed to offloading positions.
Rising open interest without downside expansion reinforces the view that the demand zone functions as a positioning base.
The leverage is not skewed aggressively short, but it seems to be balanced, reducing the risk of a breakdown in the short term. Breakout above structure would result to repositioning and increase of upside momentum.
On the other hand, a demand-less failure would unravel leverage within a short period. This will would strengthen the continuation of the trend at a lower level. Open interest therefore amplifies structural outcomes but does not dictate direction independently.
To sum up, the Golden Cross scenario of Shina Inu price in 2026 is structurally valid though conditional. Price needs to keep the demand on the defensive side and overcome the downward wedge to increase the rate of EMA convergence.
Sustained acceptance above $0.0000082 would support recovery and crossover development. However, a clear collapse of the $0.0000070 level nullifies the structure, postponing the Golden Cross formation.
Play 10,000+ Casino Games at BC Game with Ease
- Instant Deposits And Withdrawals
- Crypto Casino And Sports Betting
- Exclusive Bonuses And Rewards

Frequently Asked Questions (FAQs)
1. What is a Golden Cross in technical analysis?
2. Why does consolidation matter before a Golden Cross forms?
3. How do traders use EMA relationships in long-term analysis?

Why Trust CoinGape
CoinGape has covered the cryptocurrency industry since 2017, aiming to provide informative insights Read more…to our readers. Our journal analysts bring years of experience in market analysis and blockchain technology to ensure factual accuracy and balanced reporting. By following our Editorial Policy, our writers verify every source, fact-check each story, rely on reputable sources, and attribute quotes and media correctly. We also follow a rigorous Review Methodology when evaluating exchanges and tools. From emerging blockchain projects and coin launches to industry events and technical developments, we cover all facets of the digital asset space with unwavering commitment to timely, relevant information.
24 Hours volume
$82.29M
Market Cap
$3.37B
Max Supply
1000T


- PM Modi Holds Emergency Meet as Iran Seeks India’s ‘Independent Role’ in Ending US-Iran War
- US-Iran Tensions Spike as Trump Sets 48-Hour Deadline on Strait of Hormuz Blockade
- Breaking: U.S. Prepares for Potential Peace Talks in Iran War as Trump Mulls ‘Winding Down’ Military Efforts
- Crypto Market Recovers as Expert Warns U.S. Easing of Iran Sanctions Won’t Stabilize Oil Prices
- CLARITY Act May Still Delay Despite Stablecoin Yield Deal, Galaxy’s Alex Thorn Warns
- XRP Price Prediction Ahead of March 27 SEC Spot ETF Decision
- Will Solana Price Recover This Week Amid New SEC/CFTC Crypto Rules?
- Ethereum, XRP, and Solana Price Prediction As CLARITY Act Advances After Senate–White House Deal
- Why is Pi Network Price Up Today (March 21) Despite Market Wide Correction?
- Bittensor (TAO) Price Surges 20% After Nvidia CEO Comments
- Dogecoin, Shiba Inu, and Pepe Coin Price Prediction If BTC Holds $70k Level


