Shiba Inu Price Recovery Halts at $0.0000077 Resistance; Bullish Breakout or Reversal?


Last weekend’s recovery in the Shiba Inu price faced supply pressure at a downsloping resistance trendline. Today, with an insignificant gain of 0.1%, the coin price shows a doji-type neutral candle indicating indecision nature among traders. If no improvement is initiated in market sentiment, the dynamic resistance may pressurize the Dog-themed memecoin to lower prices. Should you enter this dip?
Also Read: Shiba Inu News: Shibarium To Burn Trillions of $SHIB Tokens
Shiba Inu Price Daily Chart:
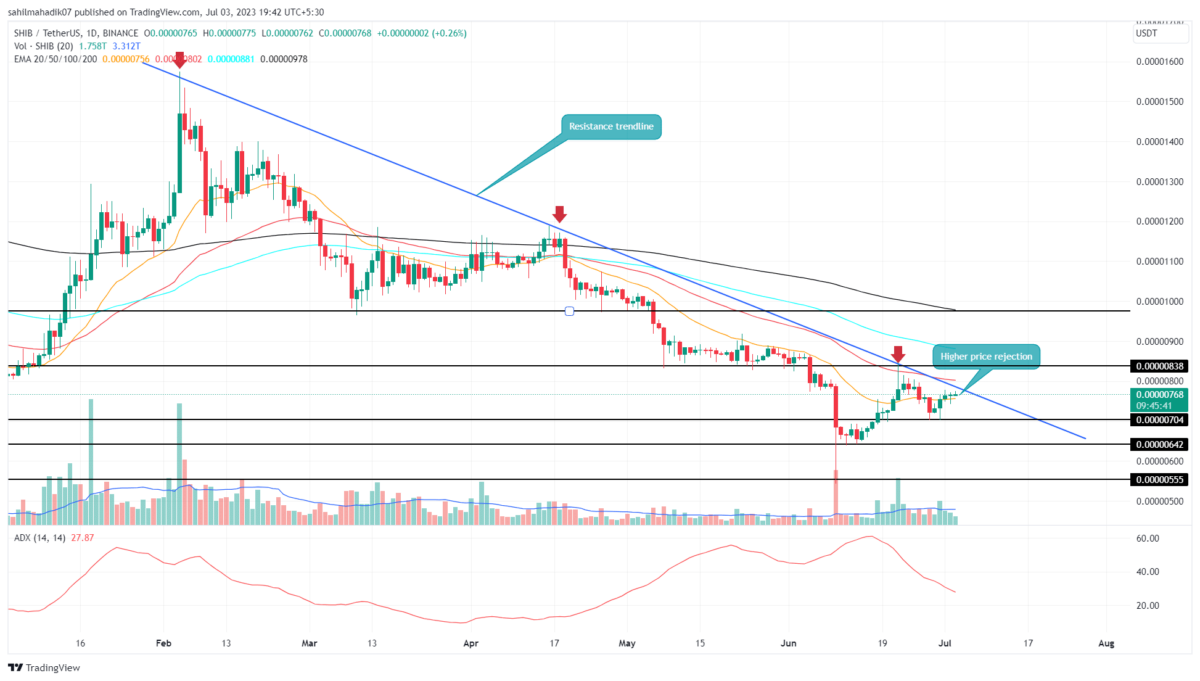
- Overhead supply pressure restricts the SHIB buyers’ rise above the $0.00008 mark.
- The Shiba Inu price may continue a downward trend until the resistance trendline is intact
- The intraday trading volume of the Shiba Inu coin is $116.2 Million, showing a 30% gain.
 Source- Tradingview
The Shiba Inu price is currently trading at the $0.00000768 mark and reflects a cautious recovery attempt in the daily chart. The formation of neutral candles in recent days indicates a lack of strong commitment from either buyers or sellers. The indecisive nature of these candles suggests a market struggle to establish a clear trend direction, creating uncertainty for SHIB’s near-term price movement.
The primary challenge for Shiba Inu lies in its ability to surpass the long-standing resistance trendline. If selling pressure strengthens at the trendline, it could trigger a bearish reversal.
In such a scenario, SHIB’s price may flip $0.00007 support and plunge to the June bottom support level of $0.00000642. A bearish reversal would confirm the dominance of the resistance trendline and the continuation of the downtrend.
Will Shiba Inu’s Price Rally to $0.00008?
A new higher low formation in SHIB price reflects a spark of new recovery sentiment among traders. Considering the bullish momentum rise with the broader market sentiment, a breakout above the resistance trendline would indicate a potential change in the prevailing trend for Shiba Inu. Such a breakout would suggest that buyers are taking control, potentially leading to an upward price movement to $0.000084, followed by $0.000098.
- Exponential Moving Average: A breakdown below the 20-Day EMA slope will offer sellers an extra edge to plunge the SHIB price lower.
- Average Directional Index: The falling ADX slope reflects the bearish trend momentum is gradually diminishing.

Why Trust CoinGape
CoinGape has covered the cryptocurrency industry since 2017, aiming to provide informative insights Read more…to our readers. Our journal analysts bring years of experience in market analysis and blockchain technology to ensure factual accuracy and balanced reporting. By following our Editorial Policy, our writers verify every source, fact-check each story, rely on reputable sources, and attribute quotes and media correctly. We also follow a rigorous Review Methodology when evaluating exchanges and tools. From emerging blockchain projects and coin launches to industry events and technical developments, we cover all facets of the digital asset space with unwavering commitment to timely, relevant information.