
Shiba Inu Price Set for $0.00001? Bullish Pattern Signal a 24% Rally Ahead


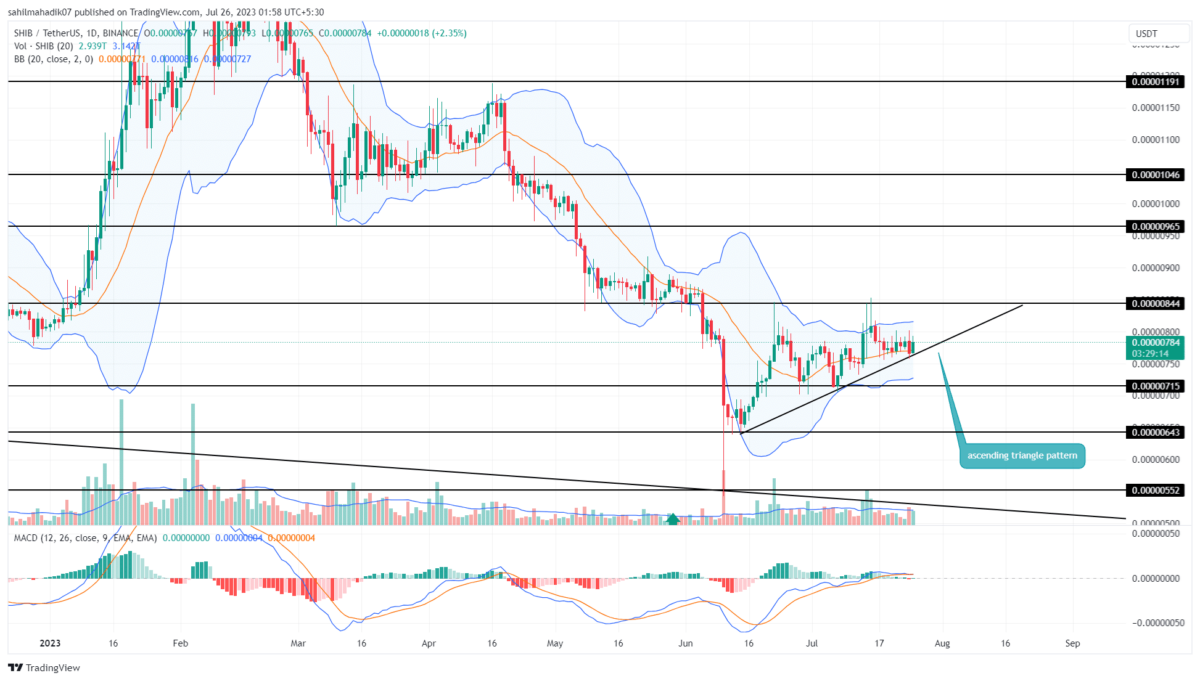
With increasing uncertainty in the crypto market, a majority of major cryptocurrencies extended their correction phase in the last two weeks. As a result, the Shiba Inu price dropped from a high of $0.00000845 to a $0.00000758 swing low registering a loss of 10%. However, a closer look at the daily time frame chart, indicates this correction is part of a long-coming bullish continuation pattern called ascending triangle pattern. Here’s how this pattern could bolster the dog-theme memecoin price for higher recovery.
Also Read: Elon Musk Discloses Why Rebranding Twitter To X Is Crucial & Impact Of Shiba Inu Dog
Shiba Inu Price Daily Chart:
- A Harami candle pattern at the support trendline reflects a potential bullish reversal of 8%.
- A bullish breakout from the $0.00000845 neckline will set the SHIB price at a fresh prolonged recovery
- The intraday trading volume of the Shiba Inu coin is $127.5 Million, showing a 9.5% loss.
 Source- Tradingview
With an intraday gain of 2.35%, the Shiba Inu price shows a strong green candle rebounding from the support trendline of a triangle pattern. This chart pattern has been carrying a recovery phase in this memecoin over the past six weeks.
This dynamic support is known to replenish bullish momentum at a market dip and bolster a bullish reversal back to overhead resistance. Moreover, the bullish candle formed today also undermines the bear attack witnessed on July 24th and increases the possibility of price reversal.
If the anticipated upswing closes about the high of yesterday’s candle(0.000008) the SHIB price will challenge the neckline resistance of $0.00000845.
A bullish breakout from the overhead resistance will boost the buying momentum and lead Shiba Inu’s price 24% higher to $0.00001.
Is SHIB Price Still Under Correction Threat?
While the Pioneer cryptocurrency Bitcoin has ended a month-long correction on a bearish note, the market sentiment has inclined toward a long correction. Therefore, if the Shiba Inu price gives a bearish breakdown below the support trendline, the triangle pattern setup will get invalidity. The resulting downfall may plunge the SHIB price back to the $0.0000064 mark
- Moving Average Convergence/Divergence: A steady recovery in the MACD indicator reflects gradual growth in buying momentum.
- Bollinger Band: this squeezed range of Bollinger Band indicators reflects high volatility in trading this memecoin.
Play 10,000+ Casino Games at BC Game with Ease
- Instant Deposits And Withdrawals
- Crypto Casino And Sports Betting
- Exclusive Bonuses And Rewards


Why Trust CoinGape
CoinGape has covered the cryptocurrency industry since 2017, aiming to provide informative insights Read more…to our readers. Our journal analysts bring years of experience in market analysis and blockchain technology to ensure factual accuracy and balanced reporting. By following our Editorial Policy, our writers verify every source, fact-check each story, rely on reputable sources, and attribute quotes and media correctly. We also follow a rigorous Review Methodology when evaluating exchanges and tools. From emerging blockchain projects and coin launches to industry events and technical developments, we cover all facets of the digital asset space with unwavering commitment to timely, relevant information.


- Meme Coins Rally: Why DOGE, SHIB, PEPE and BONK Price are Soaring?
- Breaking: Michael Saylor’s Strategy Makes Largest Bitcoin Buy This Year as MSTR Stock Rallies
- Breaking: Metaplanet Raises $531M, Revises Bitcoin Capital Allocation Policy
- Breaking: China Vows to Reclaim Taiwan by 2026 As Crypto Market Recovers
- FOMC Meeting Tomorrow: Fed Rate Cut Hopes Fade Amid US-Iran Conflicts
- Is XRP Price Gearing Up For $2 Level As BTC Rebounds Above $74k?
- Cardano’s $0.50 Resistance- Can “Midnight” Alpha Defy the Fog of War?
- Bitcoin and XRP Price Outlook If the Senate Banking Committee Approves the CLARITY Act
- Official Trump Price Prediction As TRUMP Token Soars 50% Ahead Mar-a-Lago Invite Buzz for Top Holders
- Solana vs XRP Price Forecast: Can SOL Reclaim Its All-Time High Before XRP Hits $2?
- Top Analyst Predicts Cardano Price Could Surge 100% As Bitcoin Breaks $72k


