 Buy $GGs
Shiba Inu Price Strikes 150-Days Resistance; Is $0.00001 within Reach?


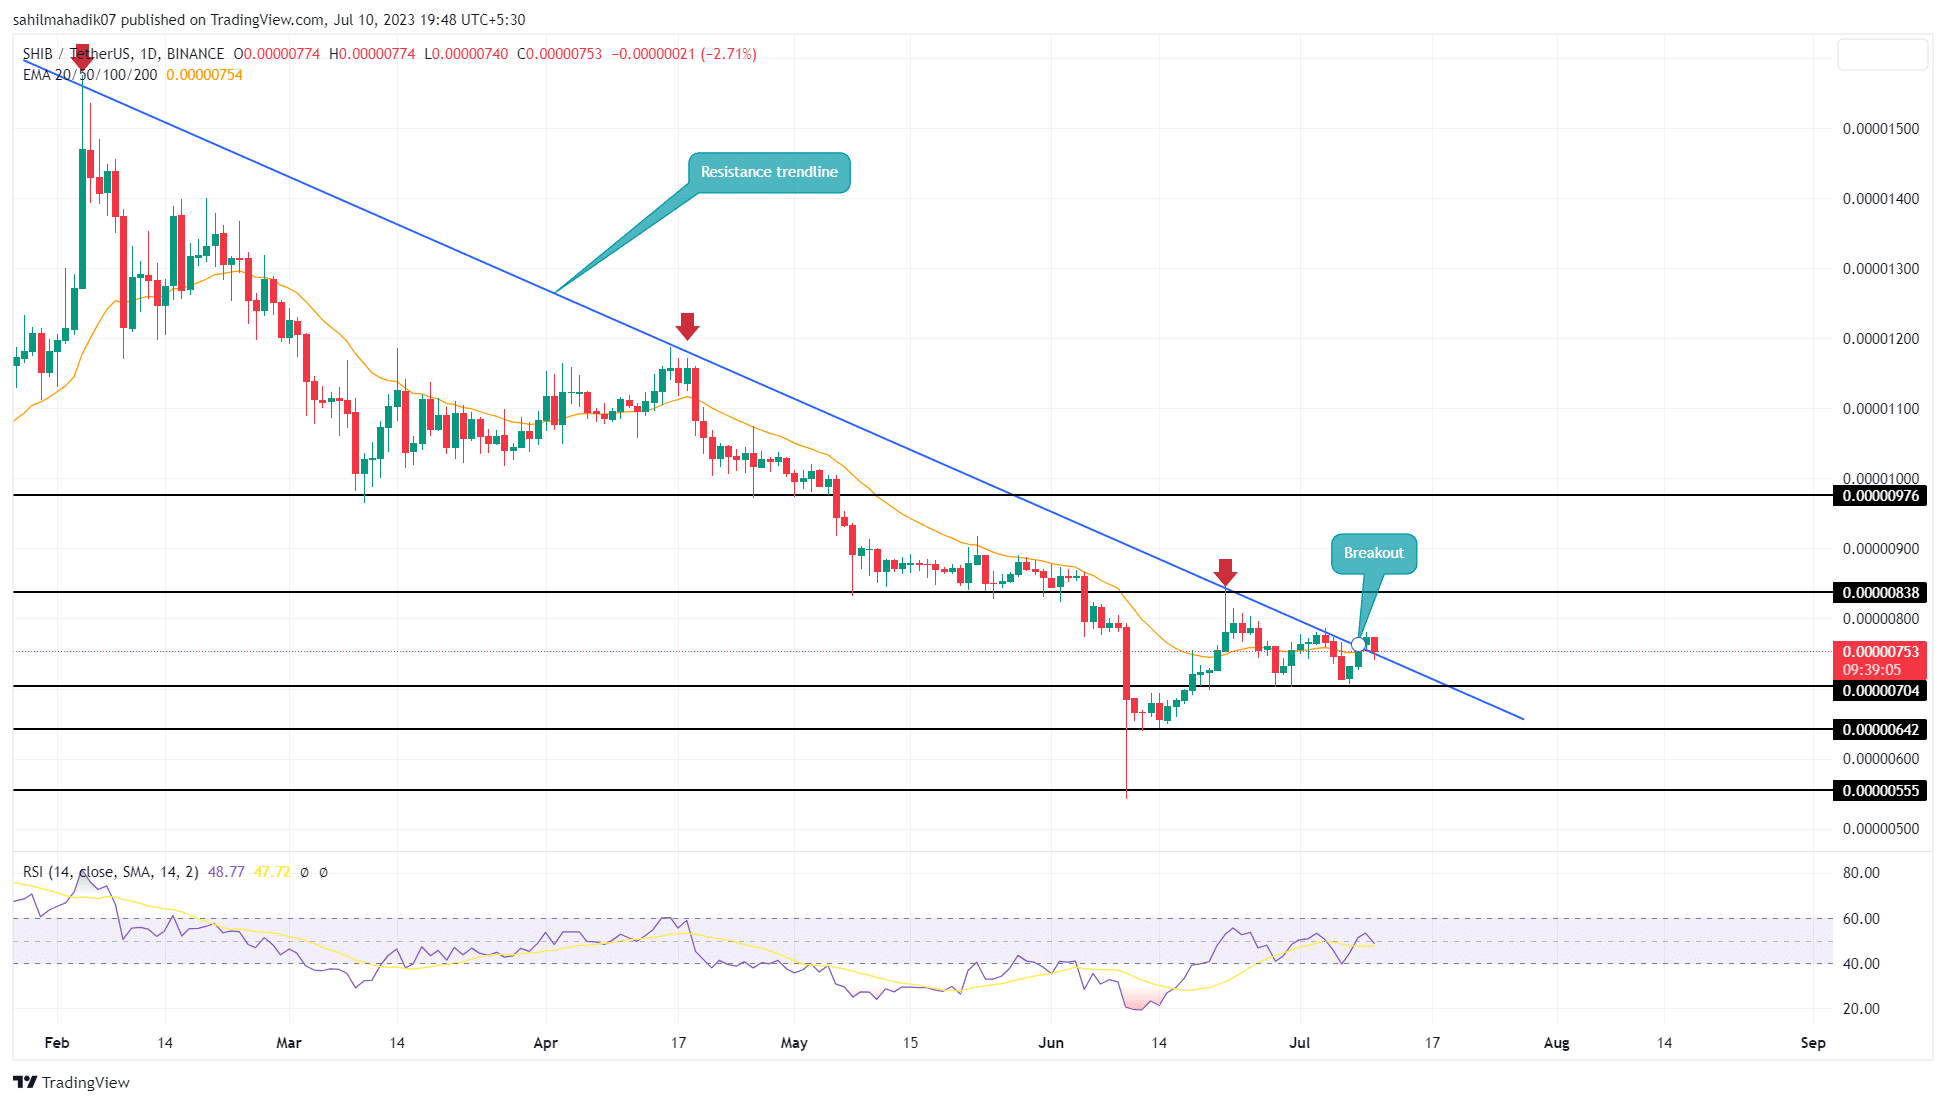
After months of a steady downtrend, the Shiba Inu price managed to breach the key resistance trendline on July 9th, indicating a potential shift in the market sentiment. Furthermore, with a red candle in the daily chart, the buyers are currently in the process of validating its sustainability at higher prices and the opportunity to buy famous memecoin. How far can the potential rally take the SHIB price?
Also Read: Shiba Inu Burn Rate Spikes Over 3000%, $SHIB Whale Transactions At 3-Month High
Shiba Inu Price Daily Chart:
- On June 9th, the Shiba Inu price experienced a significant breakout, defying months of a downtrend and offering traders a chance to ride the bullish wave.
- As SHIB retraces slightly after the breakout, buyers must hold the newly flipped support to fuel a potential rally.
- The intraday trading volume of the Shiba Inu coin is $116.2 Million, showing a 23% loss.
 Source- Tradingview
The Shiba Inu (SHIB) coin was locked in a downtrend for the past five months, facing consistent selling pressure at price rallies. However, in line with the Dow theory of the financial market, which suggests that no trend remains the same forever, SHIB price managed to break through this persistent resistance on June 9th, signaling a potential market shift.
Currently trading at $0.0000075, the SHIB price experienced a 2.7% intraday loss, prompting a pullback to retest the breached trendline for potential support. The sustainability of this support will be crucial in determining the continuation of the recovery rally.
If buyers can establish a foothold at newfound support, SHIB buyers may embark on a recovery journey, potentially pushing the price higher by 12%. Notable barriers await at $0.00000838 and $0.00000976, providing traders with targets to monitor.
Can SHIB Price Go Back To $0.0000064?
If the broader market sentiment remains uncertain, a breakdown below the trendline with a daily candle closing, would invalidate the bullish thesis and indicate a return to the downtrend. This breakdown will reveal a bull trap which would intensify the selling pressure. In such a scenario, Shiba Inu price could retest support at $0.00000642.
Play 10,000+ Casino Games at BC Game with Ease
- Instant Deposits And Withdrawals
- Crypto Casino And Sports Betting
- Exclusive Bonuses And Rewards


Why Trust CoinGape
CoinGape has covered the cryptocurrency industry since 2017, aiming to provide informative insights Read more…to our readers. Our journal analysts bring years of experience in market analysis and blockchain technology to ensure factual accuracy and balanced reporting. By following our Editorial Policy, our writers verify every source, fact-check each story, rely on reputable sources, and attribute quotes and media correctly. We also follow a rigorous Review Methodology when evaluating exchanges and tools. From emerging blockchain projects and coin launches to industry events and technical developments, we cover all facets of the digital asset space with unwavering commitment to timely, relevant information.

Related Articles


- Breaking: Morgan Stanley Applies For Crypto-Focused National Trust Bank With OCC
- Ripple Could Gain Access to U.S. Banking System as OCC Expands Trust Bank Services
- $2T Barclays Explores Blockchain For Stablecoin Payments and Tokenized Deposits
- Breaking: U.S. PPI Inflation Rises To 2.9%, BTC Price Falls
- XRP News: Ripple-Backed Ctrl Alt Completes $280M in Diamond Tokenization on XRPL
- Top Analyst Predicts Pi Network Price Bottom, Flags Key Catalysts
- Will Ethereum Price Hold $1,900 Level After Five Weeks of $563M ETF Selling?
- Top 2 Price Predictions Ethereum and Solana Ahead of March 1 Clarity Act Stablecoin Deadline
- Pi Network Price Prediction Ahead of Protocol Upgrades Deadline on March 1
- XRP Price Outlook As Jane Street Lawsuit Sparks Shift in Morning Sell-Off Trend
- Dogecoin, Cardano, and Chainlink Price Prediction As Crypto Market Rebounds


