 Claim Card
Shiba Inu Price Targets Double Bottom Breakout as Bulls Defend $0.000012 Support


Highlights
- Shiba Inu price targets a 42% rally to $0.000012 as the early stages of a double-bottom formation emerge.
- Bulls are actively defending the $0.000012 support level, which is also where most SHIB holders are profitable.
- For Shiba Inu price to rally to $0.000017, it first needs to break the key resistance level at $0.0000136.
Shiba Inu (SHIB) is down 8% since its monthly open price of $0.000013. At press time, Shiba Inu price trades at $0.0000121 with a slight 0.8% intraday gain. Meanwhile, 24-hour trading volumes on June 16 stood at $102 million as market interest dwindled. Today’s slight gains confirmed the emergence of a bullish double-bottom setup, as bulls defend a key support level at $0.000012.
Shiba Inu Price Breakout Nears as Bulls Defend $0.000012 Support
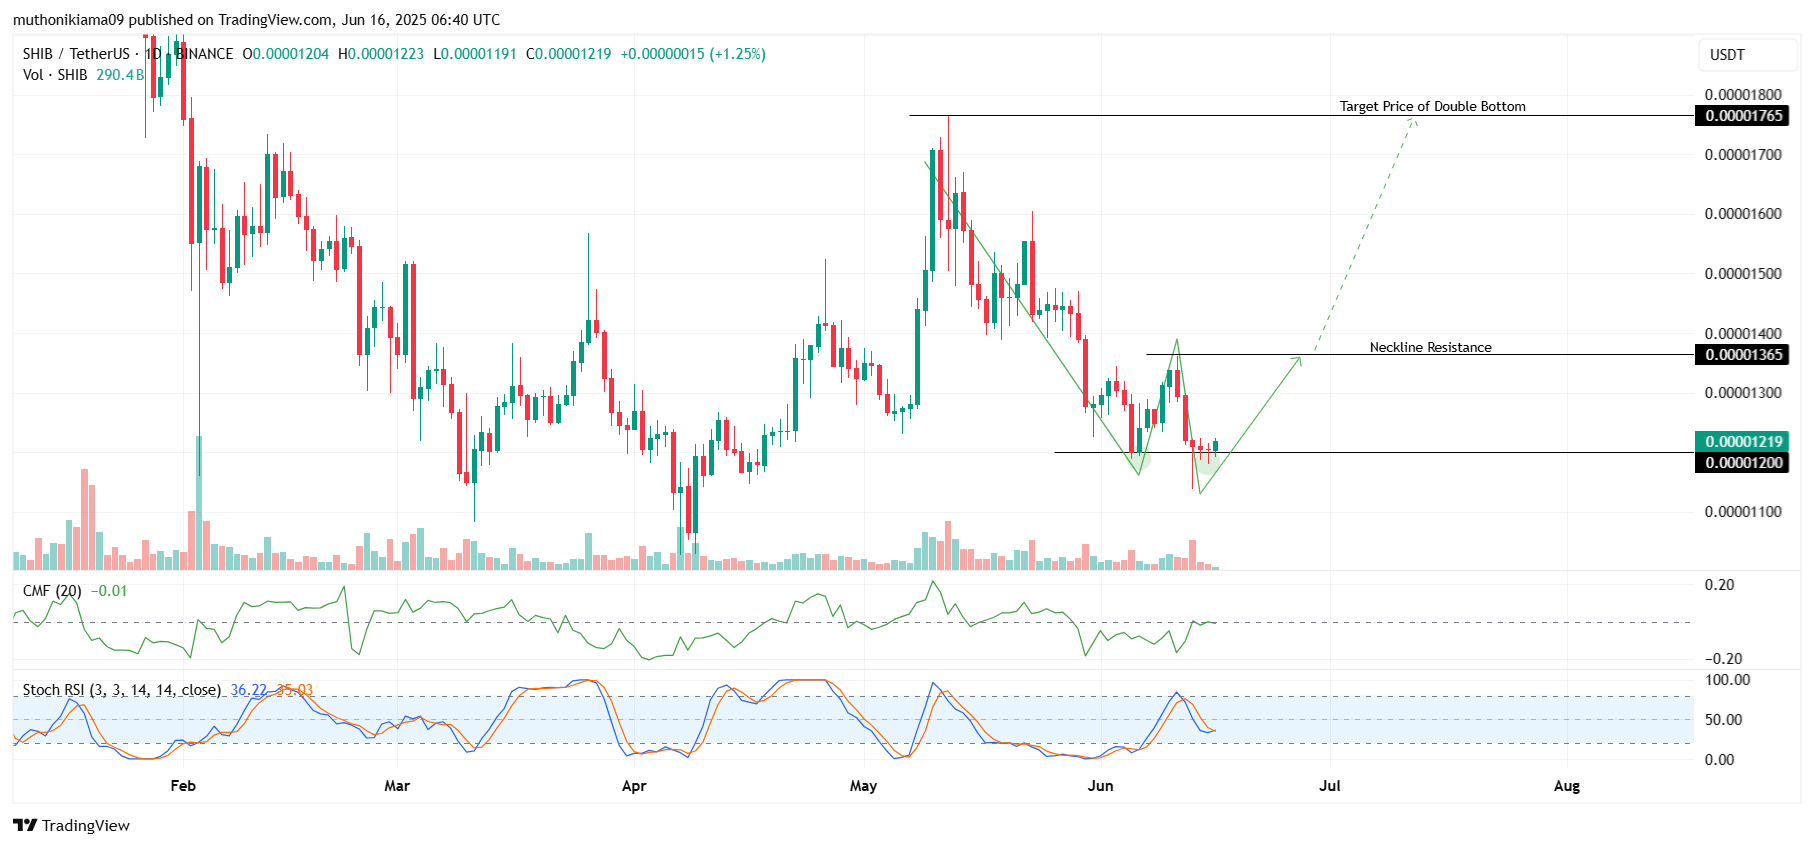
The daily timeframe for Shiba Inu price shows the emergence of a double bottom pattern that is in the early stages of formation. This pattern indicates that after the prolonged downtrend that started on May 12, SHIB price has found strong support at $0.000012.
Shiba Inu has defended the $0.000012 support level twice since the downtrend commenced. This is a sign that bulls view this price to be a good entry point, and as selling pressure eases, it creates room for an uptrend to commence.
For the double bottom to reach maturation, Shiba Inu price will have to first breach the neckline resistance that lies at $0.0000136. After this, a 42% breakout rally that is equal to the height of this pattern could emerge, pushing the price to $0.000017.
The main headwind that could derail a rally for this top meme coin is a lack of strong buying activity. Even as bulls defend $0.000012 as a crucial support level, buying activity remains scant, and as the stochastic RSI shows with a reading of 35, sellers have the upper hand. Until the stoch RSI crosses above 50, bears may keep pushing the price to the $0.000012 support.
However, the CMF shows that a breakout is looming. This metric has been oscillating at neutral levels for the past week after a sharp move north, which is a sign that buyers are looking to outperform sellers, which could be a precursor for a bull run to $0.000012.
At the same time, a recent CoinGape analysis noted that despite the month-long downtrend that commenced in early May, whales and Binance traders remain bullish on SHIB. This also supports the thesis of a breakout rally for Shiba Inu price possibly happening soon.
Key Levels to Watch
The In Out of the Money Around Price (IOMAP) metric per IntoTheBlock’s data supports the technical structure outlining $0.000012 as a major support. This is because 30,000 addresses bought more than 15 trillion SHIB tokens at this price.
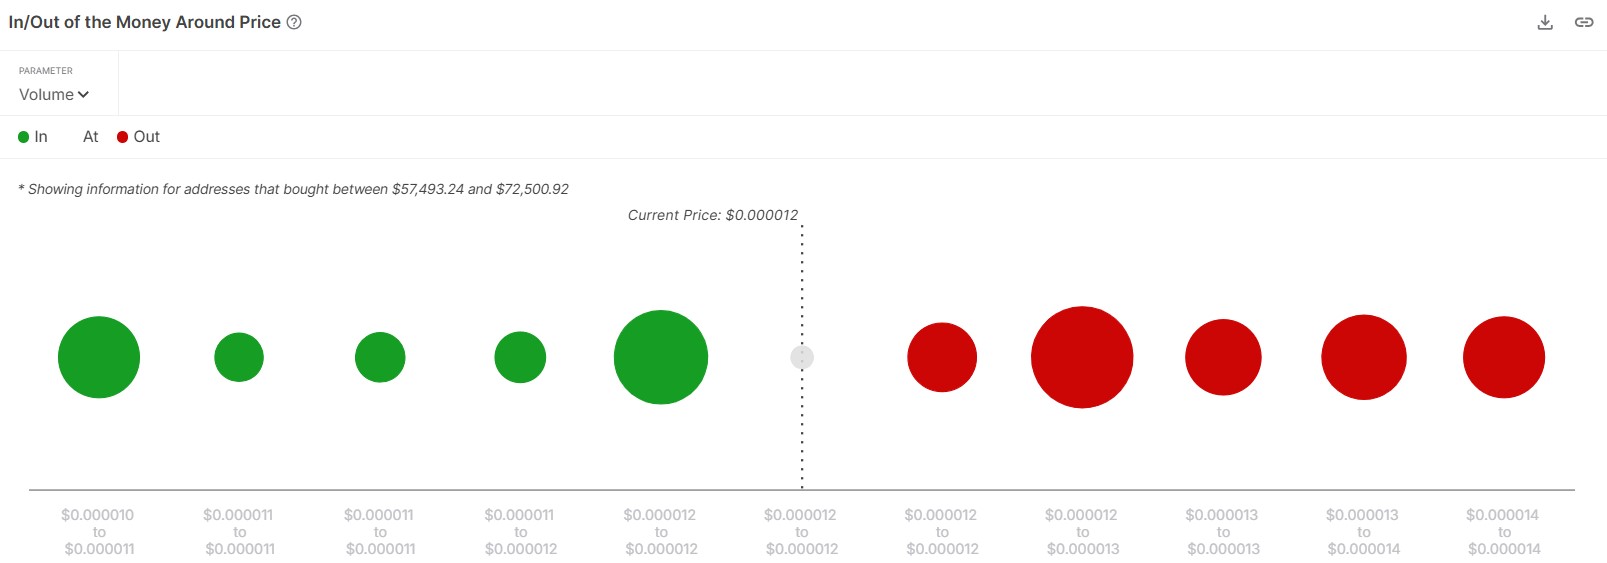
Considering that most SHIB holders who are currently profitable bought the meme coin at this price level, it may be viewed by traders as the best buying price. Hence, a surge in buying activity could occur as Shiba Inu price trades close to this support.
Conversely, there is a very strong resistance level that stands at $0.000013, where more than 22,000 traders bought more than 19 trillion SHIB. For the double bottom pattern breakout to $0.000017 to occur, SHIB price needs to overcome this key resistance level.
In conclusion, Shiba Inu price is at an inflection point as bulls defend key support at $0.000012. If this support holds and SHIB crosses past the $0.0000136 resistance, the price may push towards $0.000017, attaining the target of a double-bottom pattern.
While this is a short-term outlook on SHIB’s performance, a long-term Shiba Inu price prediction outlines what to expect from the meme token from 2025 to 2030.
Frequently Asked Questions (FAQs)
1. Can Shiba Inu price break out after forming a double bottom pattern?
2. Why are bulls defending the $0.000012 support level?
3. What are the key levels to watch in SHIB price?

Why Trust CoinGape
CoinGape has covered the cryptocurrency industry since 2017, aiming to provide informative insights Read more…to our readers. Our journal analysts bring years of experience in market analysis and blockchain technology to ensure factual accuracy and balanced reporting. By following our Editorial Policy, our writers verify every source, fact-check each story, rely on reputable sources, and attribute quotes and media correctly. We also follow a rigorous Review Methodology when evaluating exchanges and tools. From emerging blockchain projects and coin launches to industry events and technical developments, we cover all facets of the digital asset space with unwavering commitment to timely, relevant information.
24 Hours volume
$74.37M
Market Cap
$3.54B
Max Supply
1000T

Related Articles


- Expert Predicts Deeper Bitcoin Decline as JPMorgan CEO Warns of Similarities to the 2008 Financial Crisis
- Trump Won’t Pardon FTX’s Sam Bankman-Fried (SBF), White House Says
- Third Spot SUI ETF Goes Live as 21Shares Fund Launches on Nasdaq
- Mark Zuckerberg’s Meta Reportedly Eyes Stablecoin Integration This Year Amid Regulatory Clarity
- Coinbase Rivals Robinhood As It Rolls Out Stocks, ETFs Trading In ‘Everything Exchange’ Push
- Cardano Price Signals Rebound as Whales Accumulate 819M ADA
- Sui Price Eyes Recovery as Third Spot SUI ETF Debuts on Nasdaq
- Pi Network Price Eyes a 30% Jump as Migrations Jumps to 16M
- Will Ethereum Price Dip to $1,500 as Vitalik Buterin Continues Selling ETH?
- XRP Price Outlook as Clarity Act Passage Odds Plunge to 53%
- COIN Stock Risks Crashing to $100 as Odds of US Striking Iran Jump


