 Buy $GGs
Solana Price Analysis: Bulls Aims For $50.0 Amid Sustained Buying Momentum


The Solana price analysis maintains a buy view on the coin. The ninth largest cryptocurrency by market cap holds the 24-hour trading volume at $1,856,518,387, down 24%. Currently, the SOL/USD pair is trading at $44.42 with more than 5% gains.
- SOL price picks up the momentum following the previous session’s sell-off.
- Bulls attempt to take out multiple resistance around the $45 zone.
- However, a daily candlestick below $41.50 would ignore the bullish argument.
SOL looks for upside confirmation
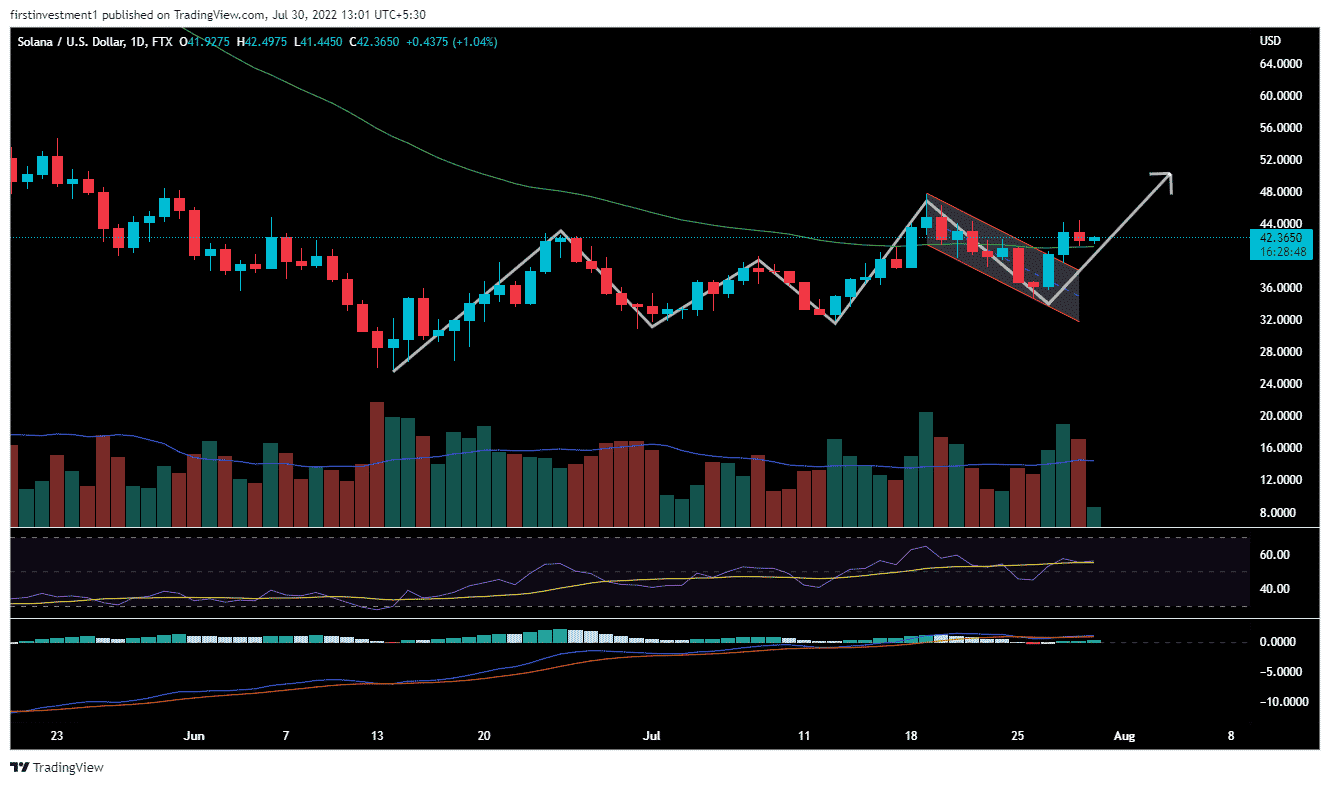
SOL price trades with gains in the last three days as the bulls are back in action. On the daily chart frame, the price given a breakout out of a bullish flag and pole pattern. The price is making higher highs and higher lows on daily charts. As well as, the average volume indicates that the price might ignore any bearish sentiment as of now
In addition to that, the buyers managed to float the price above the critical 50-day EMA at $41,21. The price could further move upward to test the psychological $50.0 mark followed by highs of May 23 at $54.65
Indicators are also supporting bullishness. The momentum oscillators, MACD and RSI hold above the average line, indicating signs of continuation trend i.e. Uptrend.
On the other hand, a daily close below the session’s low would indicate selling in the asset. On moving lower the support could be found near $40.0.
1-hour chart looks bullish
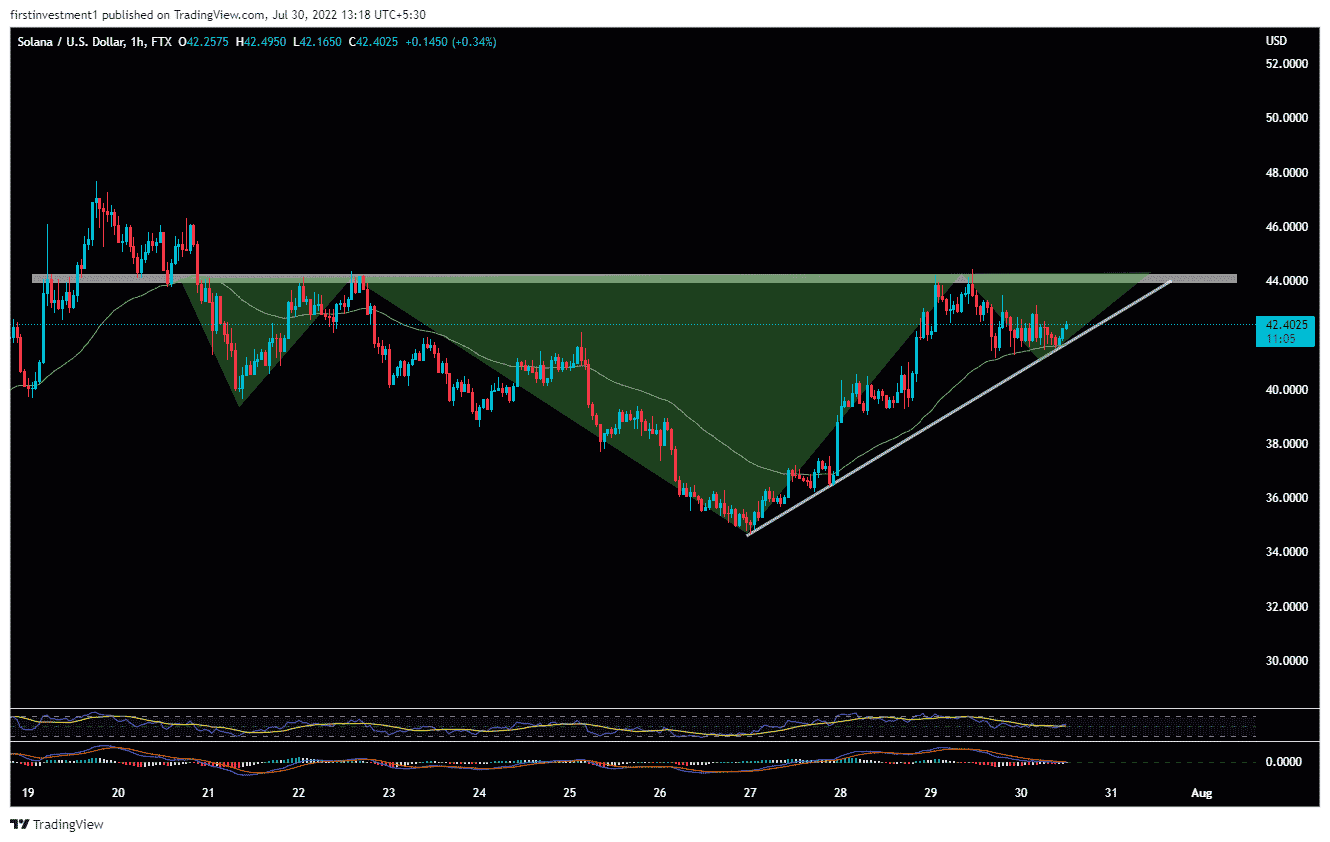
On the hourly chart, the DOT price is forming an inverted head and shoulder pattern. The right shoulder had taken good support from the 50-day exponential moving average, as well as the support of a rising trend line.
If the price sustains above 44.50 on the hourly chart, then we can expect a good bullish momentum.
Conclusion:
The SOL price analysis showcases bullish momentum in all time frames. Any retracement in price is a good buying opportunity.
Play 10,000+ Casino Games at BC Game with Ease
- Instant Deposits And Withdrawals
- Crypto Casino And Sports Betting
- Exclusive Bonuses And Rewards


Why Trust CoinGape
CoinGape has covered the cryptocurrency industry since 2017, aiming to provide informative insights Read more…to our readers. Our journal analysts bring years of experience in market analysis and blockchain technology to ensure factual accuracy and balanced reporting. By following our Editorial Policy, our writers verify every source, fact-check each story, rely on reputable sources, and attribute quotes and media correctly. We also follow a rigorous Review Methodology when evaluating exchanges and tools. From emerging blockchain projects and coin launches to industry events and technical developments, we cover all facets of the digital asset space with unwavering commitment to timely, relevant information.

Related Articles


- US-Iran War: Reports Confirm Bombings In UAE, Bahrain and Kuwait As Crypto Market Makes Recovery
- XRP Price Dips on US-Iran Conflict, But Capitulation Signals March Rebound
- Crypto Market at Risk as U.S.–Iran War Threatens Inflation With Oil Price Surge
- Polymarket U.S.–Iran Strike Bets Fuel Insider Trading Speculation as Crypto Traders Net $1.2M
- Cardano’s DeFi TVL Climbs as USDCx Stablecoin Launches on Network
- Circle (CRCL) Stock Price Prediction as Today is the CLARITY Act Deadline
- Analysts Predict Where XRP Price Could Close This Week – March 2026
- Top Analyst Predicts Pi Network Price Bottom, Flags Key Catalysts
- Will Ethereum Price Hold $1,900 Level After Five Weeks of $563M ETF Selling?
- Top 2 Price Predictions Ethereum and Solana Ahead of March 1 Clarity Act Stablecoin Deadline
- Pi Network Price Prediction Ahead of Protocol Upgrades Deadline on March 1


