 Buy $GGs
Solana Price Analysis: $SOL Price Out from Long Correction Gaze on $26 Target; Buy Now?


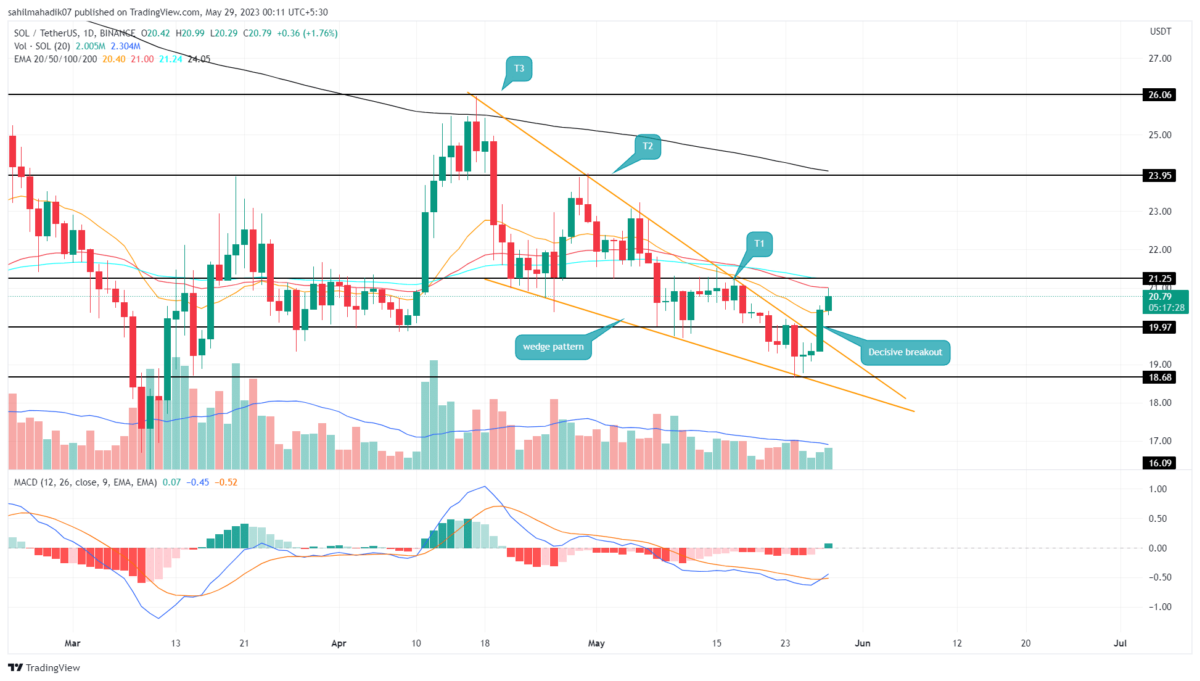
Solana Price Analysis:: Amid the recent correction in the crypto market, the falling Solana price resonated between the two converging trendlines of the falling wedge pattern. In its core concept, this chart setup signals a gradual decrease in bearish momentum, which eventually offers trend control in buyers’ hands. A bullish breakout from this pattern signals the end of the prevailing correction phase or the start of a new recovery rally.
Solana Price Daily Chart
- A bullish breakout from the long-coming resistance trendline signals a shift in market sentiment from selling on rallies to buying on dips
- A potential rally in Solana price may face overhead supply at $21.7 and $24.
- The 24-hour trading volume in the Solana coin is $277.5 Million, indicating a 148% gain.
 Source-Tradingview
On May 25th, the Solana price gave a massive breakout from the resistance trendline of the wedge pattern. After facing multiple rejections from this dynamic resistance in the last five weeks, this breakout signifies the weapon of sellers has been breached the buyers can wrestle to take trend control.
As of now, the Solana price trades at $20.67 with an intraday gain of $1.17. This follow-up green candle indicates the bullish momentum is aggressive and thus adds more conviction to coin holders.
However, the coin price witnessed a minor pullback to retest the breached trendline as potential support. If the buyers manage to sustain above the reclaimed trendline, the potential rally could reach the $26 mark, a projection of a 26% growth potential.
Will Solana Price Reach $26?
The completion of the wedge pattern has set the Solana price for a massive recovery. However, in the core concept, each swing high during the pattern formation is a valid target for buyers after the breakout. Thus, the SOL price may witness in between hurdles like $21.25 and $24 before hitting the $26 high
Moving Average Convergence Divergence: A bullish crossover between the MACD(blue) and the signal(orange) projects a sign of trend reversal.
Exponential Moving Average: The 50-and-100-day EMA moving near the $21.17 mark creates a high supply zone against buyers.
Play 10,000+ Casino Games at BC Game with Ease
- Instant Deposits And Withdrawals
- Crypto Casino And Sports Betting
- Exclusive Bonuses And Rewards


Why Trust CoinGape
CoinGape has covered the cryptocurrency industry since 2017, aiming to provide informative insights Read more…to our readers. Our journal analysts bring years of experience in market analysis and blockchain technology to ensure factual accuracy and balanced reporting. By following our Editorial Policy, our writers verify every source, fact-check each story, rely on reputable sources, and attribute quotes and media correctly. We also follow a rigorous Review Methodology when evaluating exchanges and tools. From emerging blockchain projects and coin launches to industry events and technical developments, we cover all facets of the digital asset space with unwavering commitment to timely, relevant information.

Related Articles


- Is World War III Near? Bitcoin Price Drops As UK, France, Germany Consider Iran Action
- Is Bitcoin Dead? Here’s What the Data Really Says
- US-Iran War: Meme Coin Market Plunges After Iranian Drone Hits US Embassy in Kuwait
- Arthur Hayes Sees 5x HYPE Token Rally as Oil Perps Pump on Hyperliquid Amid U.S.–Iran War
- How BTC, ETH and XRP Prices React as Crude Oil and Safe Havens Surge After Khamenei’s Death
- Bitcoin And XRP Price As US Kills Iran Supreme Leader- Is A Crypto Crash Ahead?
- Gold Price Prediction 2026: Analysts Expect Gold to Reach $6,300 This Year
- Circle (CRCL) Stock Price Prediction as Today is the CLARITY Act Deadline
- Analysts Predict Where XRP Price Could Close This Week – March 2026
- Top Analyst Predicts Pi Network Price Bottom, Flags Key Catalysts
- Will Ethereum Price Hold $1,900 Level After Five Weeks of $563M ETF Selling?


